- Gold extends bounces off 38.2% Fibonacci retracement.
- The monthly descending trend line will challenge buyers past-23.6% Fibonacci retracement.
- Mid-January low could also challenge the sellers.
Gold prices remain modestly changed to $1,566.50 during the pre-Europe session on Friday. Still, the yellow metal remains positive while gaining back its stand above 21-day SMA.
With this, the precious metal is heading towards 23.6% Fibonacci retracement of its rise from November 2019 to January top, near $1,573. However, a downward sloping trend line since January 08 close to $1,589.50 could challenge buyers.
Should there an upside past-$1,590, $1,600 round-figure will be important to watch as a break of which could propel the quote towards the yearly high surrounding $1,612.
On the contrary, the bullion’s daily closing below a 21-day SMA level of $1,564 can drag it back to 38.2% Fibonacci retracement near $1,549.50.
If at all buyers fail to turn up around $1,549.50, January 14 lows of $1,536 will be of importance to the bears.
Gold daily chart
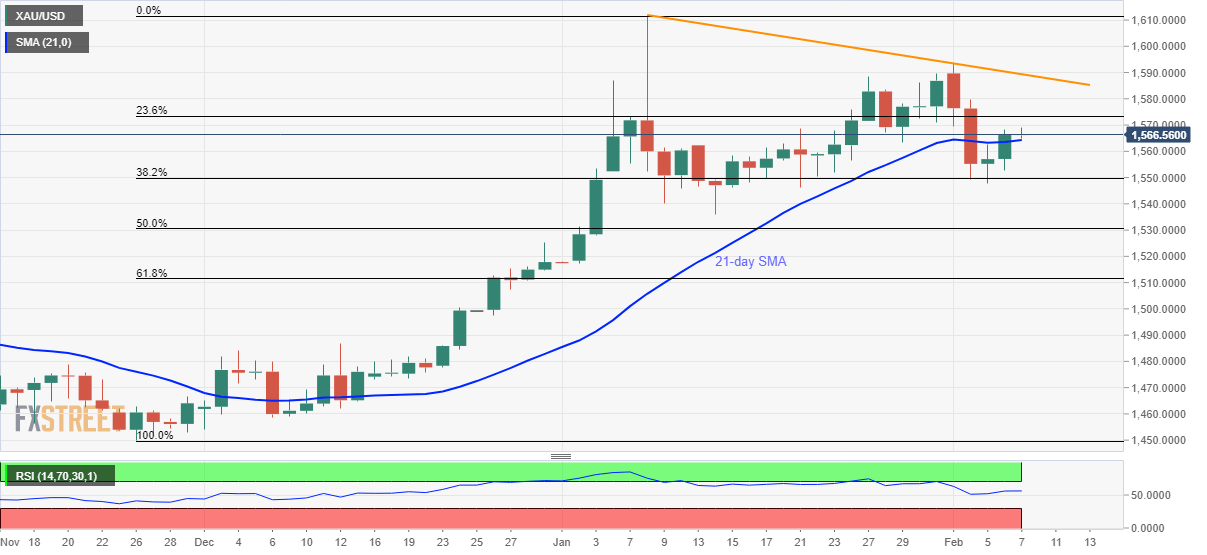
Trend: Bullish
