- Gold prices pull back from multi-year high amid overbought RSI.
- An ascending trend line from September 2019, 21-day SMA offer nearby supports.
- Bulls will target the year 2013 top, $1700 during the fresh run-up.
Gold recovers most of the early-day losses while trading around $1,658, -0.10%, while heading into the European session on Tuesday. Even so, it needs to cross Monday’s high for the fresh rise.
If the yellow metal manages to ignore overbought RSI conditions beyond $1,690, the high of 2013 near $1696 as well as $1,700 will be on the bulls’ radar.
It should, however, be noted that the commodity’s rise past-$1,700 can take aim at highs marked during November and October 2012, respectively near $1,751 and $1,794.
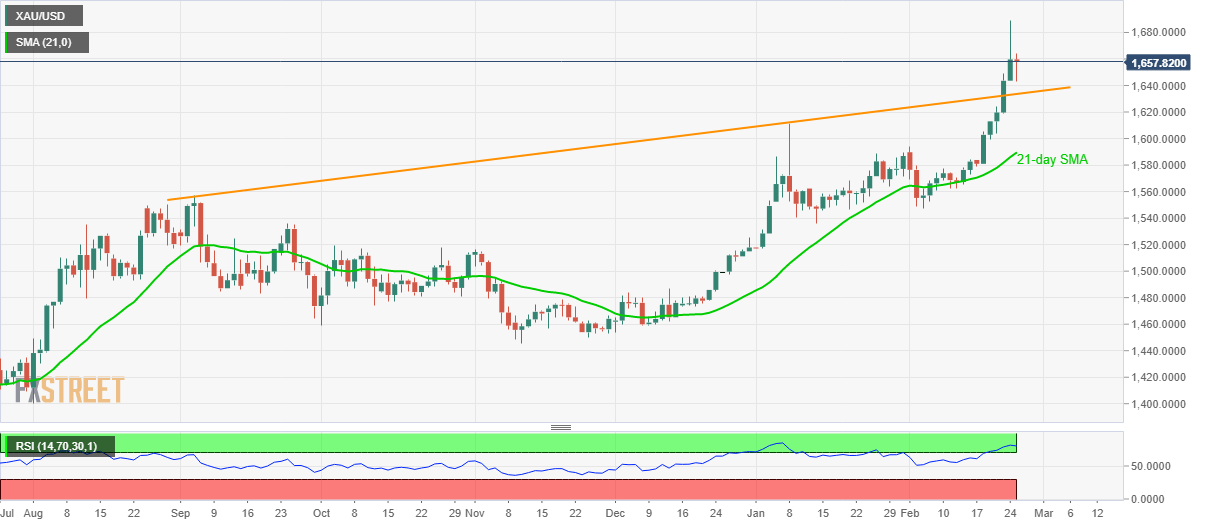
Alternatively, the metal’s declines below the stated resistance-turned-support, at $1,633 now, can recall March 2013 top near $1,617 and $1,600 mark ahead of pushing the bears to 21-day SMA near $1,590.
Gold daily chart
Trend: Bullish
