- Gold fails to cheer the disappointment from US President Trump’s coronavirus action plan.
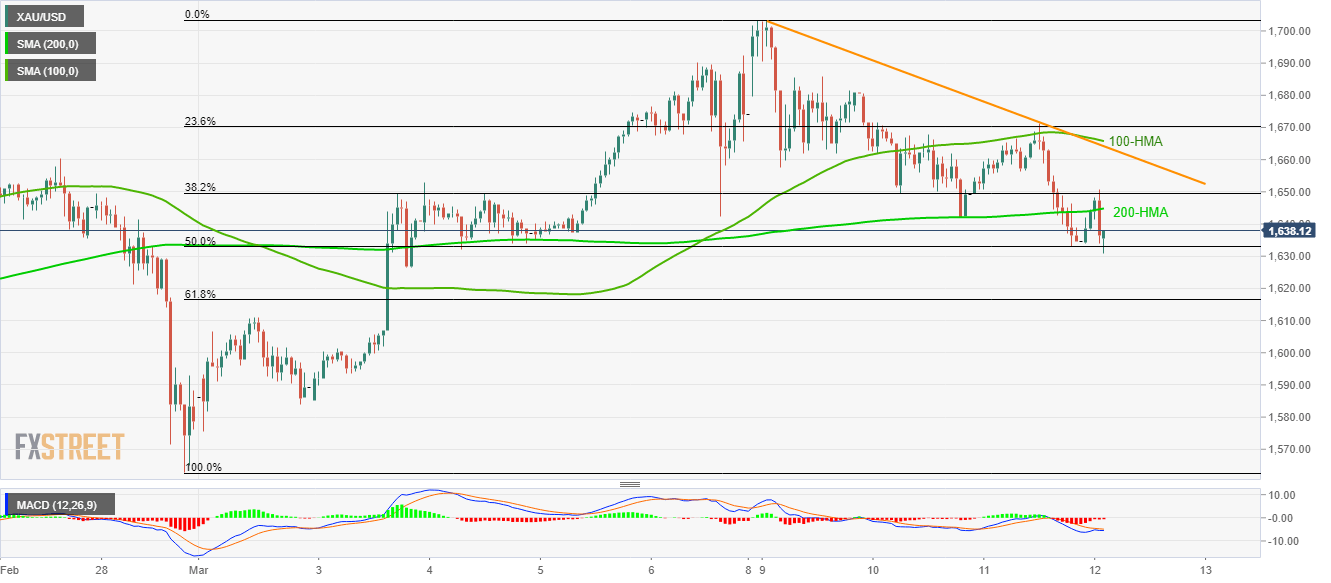
- The weekly descending trend line, 100-HMA act as the key resistance.
- Sellers will wait for sustained trading below 50% Fibonacci retracement.
Despite an increase in the market’s risk-off moves following US President Donald Trump’s fiscal stimulus, Gold prices trimmed some gains to $1,638.50 during early Thursday.
In doing so, the yellow metal takes rounds to 200-Hour Simple Moving Average (HMA), at $1,644.60 now, while staying below the $1,665/66 resistance confluence including 100-HMA and weekly falling trend line.
While buyers are waiting for entry beyond $1,666, sellers also look for an opportunity below 50% Fibonacci retracement of February 28 to March 09 upside, at $1,633.
It’s worth mentioning that MACD is teasing the bulls and hence the bullion’s run-up beyond $1,666, towards $1,690, becomes quite likely.
Alternatively, the yellow metal’s sustained declines below $1,633 might not refrain to question the March 02 top near $1,610.
Gold hourly chart
Trend: Bullish
