- Gold bugs are losing their grip and focus is on the downside.
- Bears can seek a full test of familiar Fibs and potentially take on confluence areas in a deeper retracement.
Gold prices are trapped between support and resistance but there is a bearish bias until a full test of at least the 38.2% Fibonacci retracement level.
The following is a top-down analysis that illustrates where there could be, first, a bullish opportunity in a healthy correction, to second, a subsequent downside extension.
Monthly chart
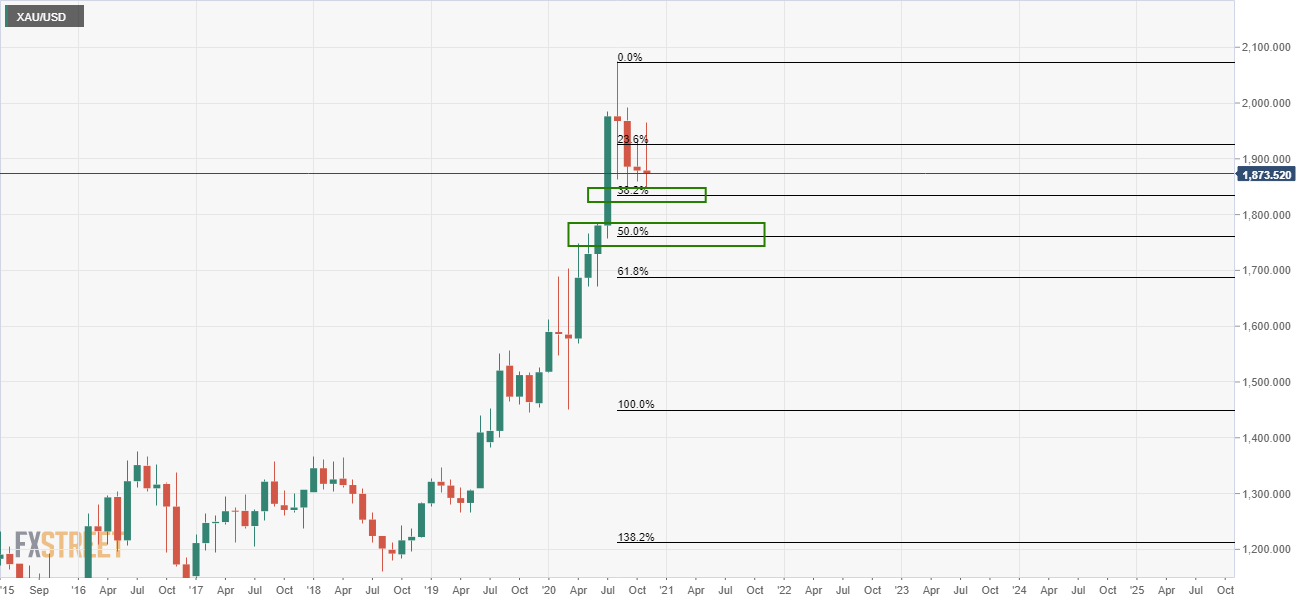
Bears seeking a fuller retracement, eye the 38.2% Fibo and a 50% mean reversion thereafter.
At a stretch, the 61.8% Fibo has a confluence with prior resistance structure.
Weekly chart
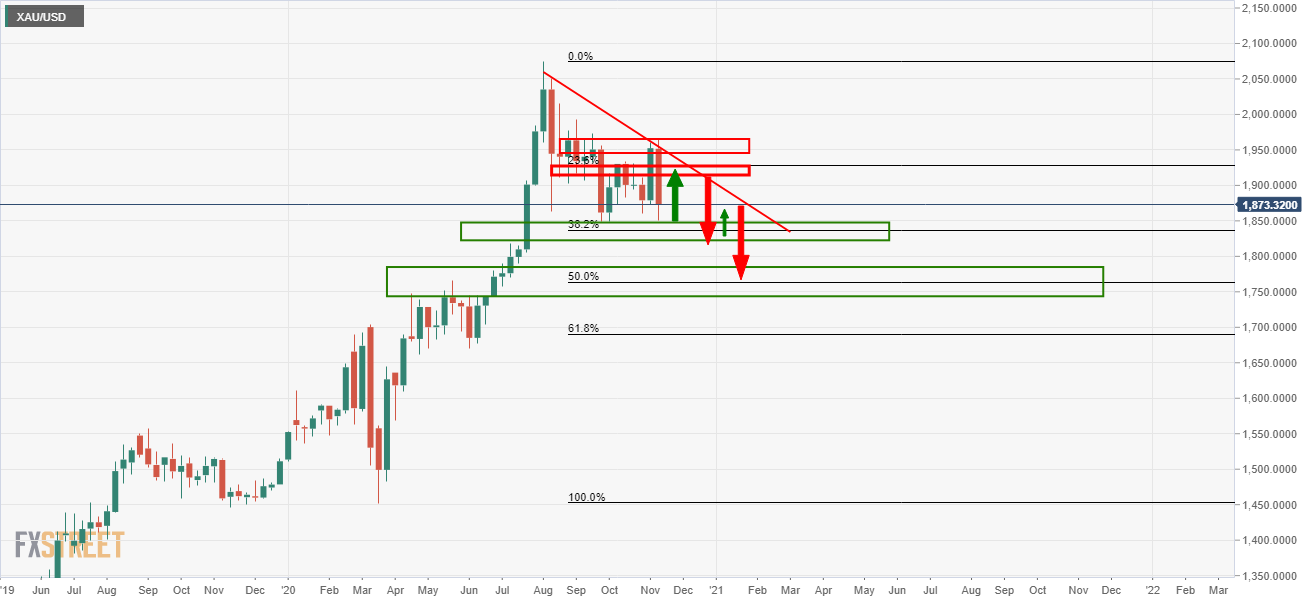
The weekly chart shows that the price has been firmly rejected in the prior structure and marks a trendline resistance as well.
Support holds and could equate to a meanwhile upside correction prior to the next bearish impulse.
Daily chart
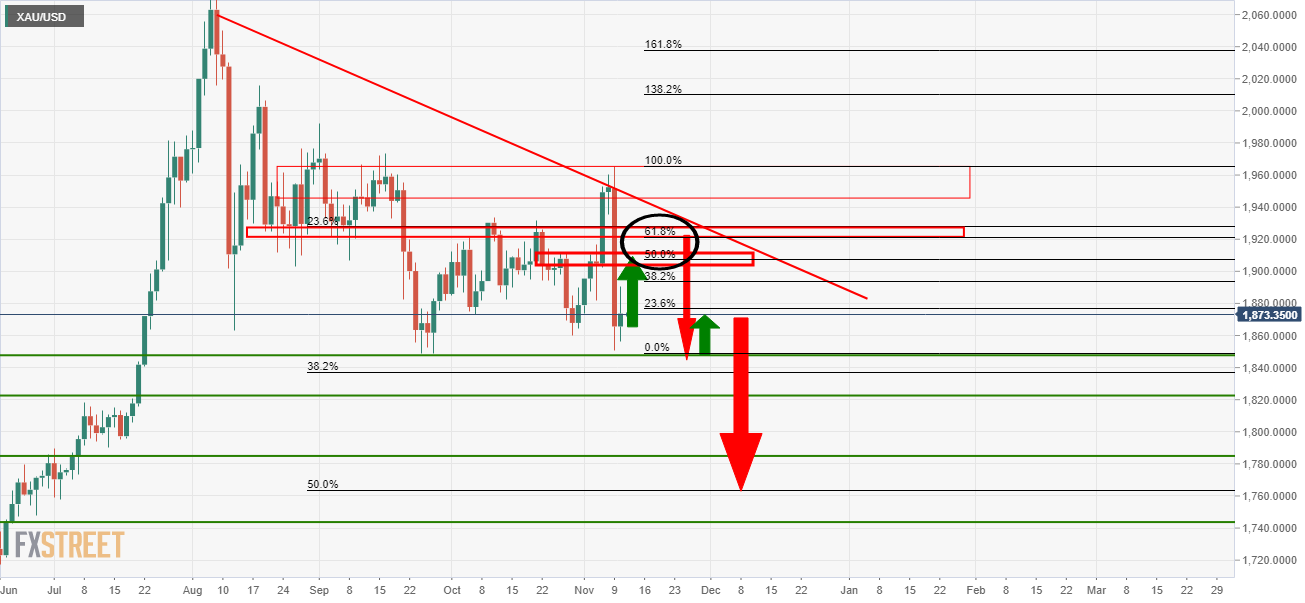
The bulls can target at least a 50% mean reversion to prior structure or a fuller retracement to the 61.8% Fibo.
