- Gold prices remain in the small range after stepping back from Tuesday’s high.
- Buyers look for an upside break of the triangle resistance, 50-HMA.
- 50% Fibonacci retracement, 200-HMA could check sellers on the downside break of the triangle.
Gold prices remain mildly positive near $1,647 amid the early Thursday morning in Asia. The bullion has been trading in a range between $1,641 and $1,658 off-late. Even so, it does portray a descending triangle bullish formation on the hourly (H1) chart.
In addition to the triangle’s resistance line, 50-HMA also increases the importance of $1,653 as the near-term key upside barrier.
While MACD and RSI are both signaling neutral sentiment, the continuation of a broad recovery should remain on the cards.
As a result, the yellow metal’s run-up beyond $1,653 could propel it to the weekly top of $1,674.15 whereas $1,700 and the previous month high near $1,703 will lure the bulls afterward.
Alternatively, the quote’s declines below the formation’s support of $1,641 could drag it to March 04 high surrounding $1,626.
Though, a confluence 200-HMA and 50% Fibonacci retracement of March 31 to April 06 rise, close to $1,621, can question the sellers below $1,626.
Gold hourly chart
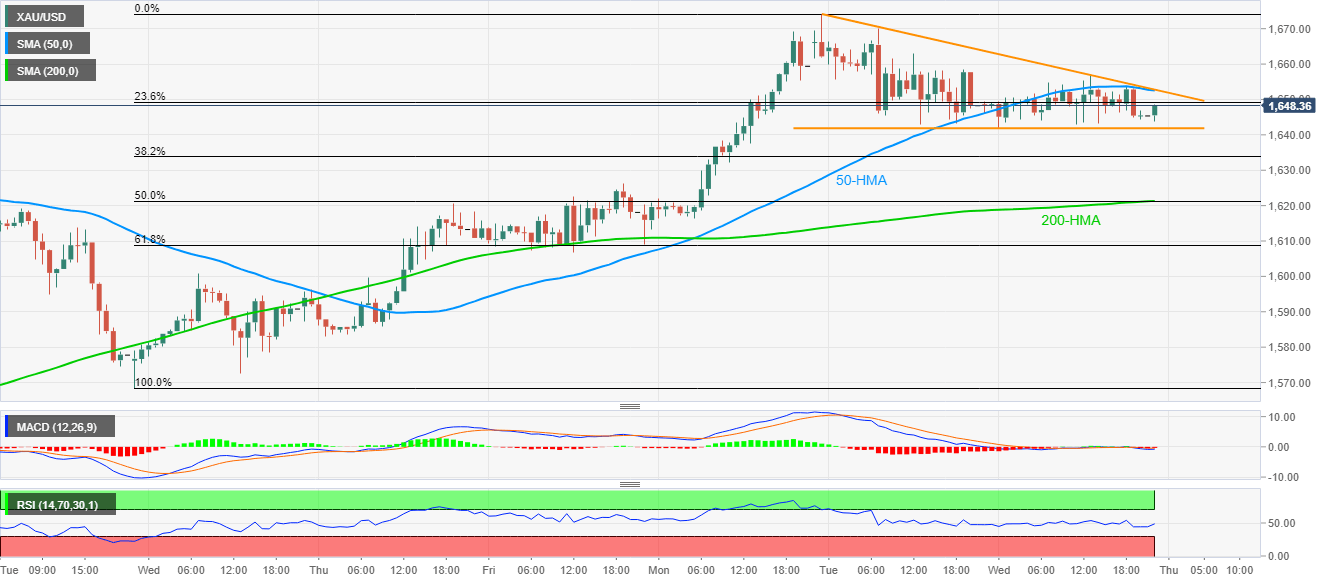
Trend: Bullish
