- Gold price is testing bullish commitments at critical levels.
- Bulls look to weekly chart for guidance back to a mean reversion.
As per the prior analysis during Federal Reserve’s Jerome Powell’s event, Gold Price Analysis: Bears back in play on Fed’s Powell, eyeing $1,698, the price indeed melted to the target, printing a low of $1,686.40 and the verge of reaching the measured $1,685 target.
At the time of writing, gold is trading at $1,692 and down some 0.3% and is trading in a bearish environment.
Prior analysis
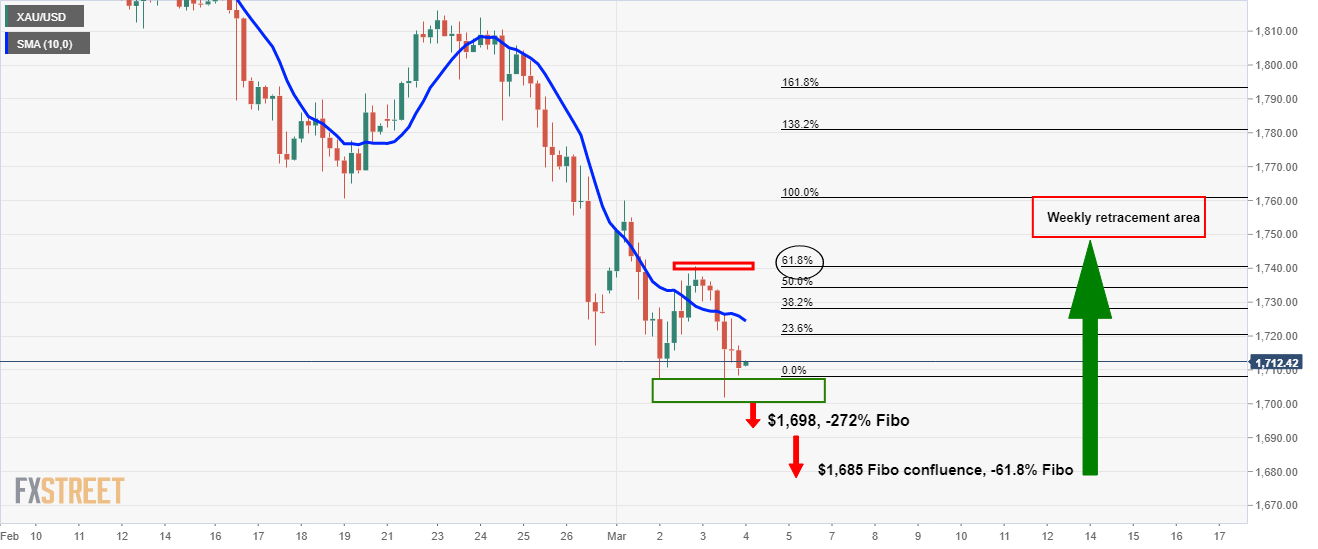
A break of 1,700 opens risk to $1,685 as a measured Fibonacci retracement target of the range between $1,760 and Wednesday’s low of $1,702. It is also the -61.8% Fibo retracement of the 4-hour correction’s range.
$1,698 comes as the -272% Fibo of the same range which may offer strong support.
Live market
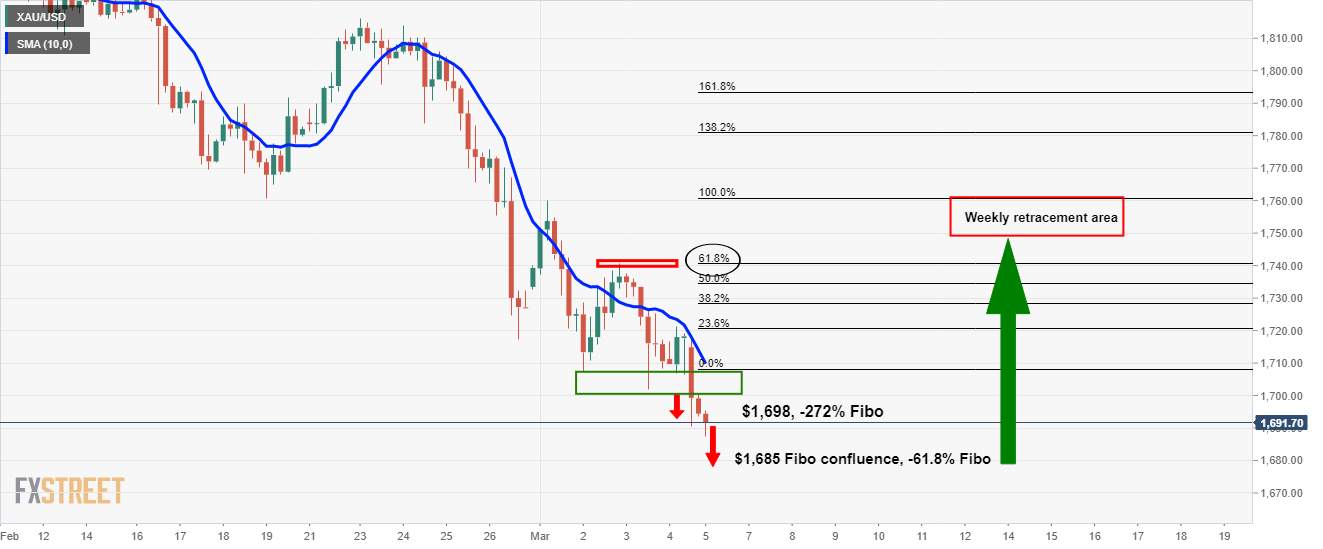
As illustrated, the price has indeed melted as per the playbook coming in a couple of dollars of the downside target.
Conditions on the hourly chart are bearish as well:
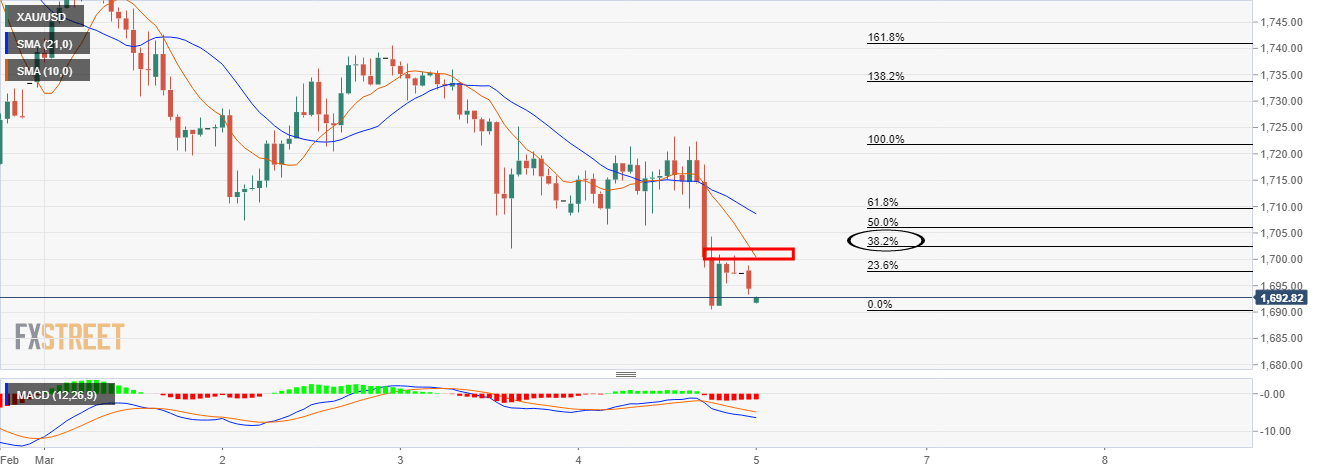
That being said, the price is yet to correct to a 38.2% Fibonacci level, so there is still room for upside before further downside.
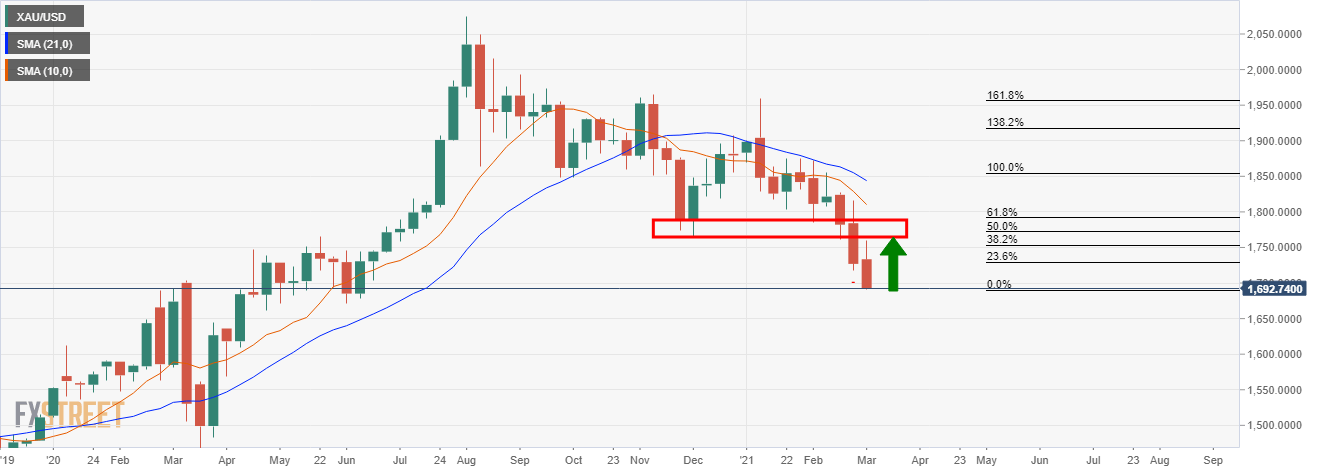
Meanwhile, the weekly chart is still compelling and requires a correction.