- Gold bulls run out of steam at critical daily resistance.
- Gold bears back in charge below 4-hour resistance.
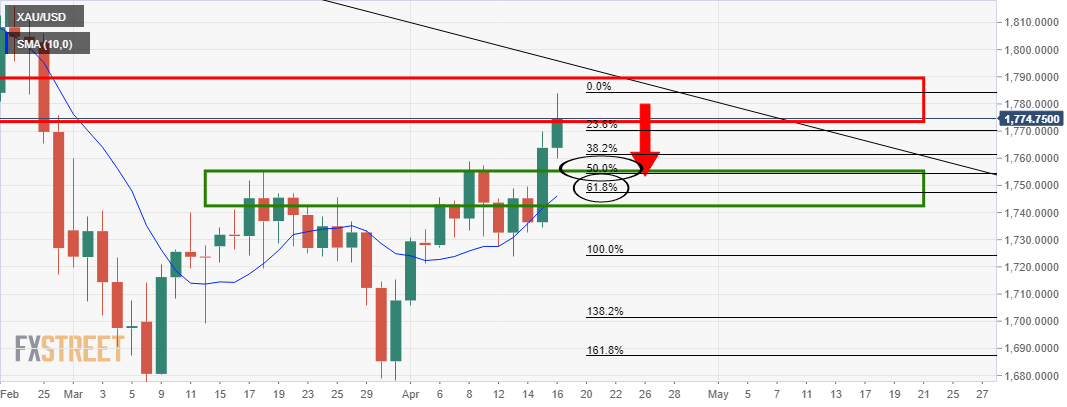
As per the prior analysis at the start of the week, ‘The Chart of the Week: Gold on verge of significant correction’, and ‘Gold Price Analysis: Bulls come up for their last breaths?’, the price is showing signs of exhaustion on the top side of the supply zone at $1,790.
Prior analysis, daily charts
The daily chart has seen a bullish close, and there is room to go on the upside yet.
With that being said, the prior highs looking left have a confluence with a 50% mean reversion of the last few sessions of bullish closes.
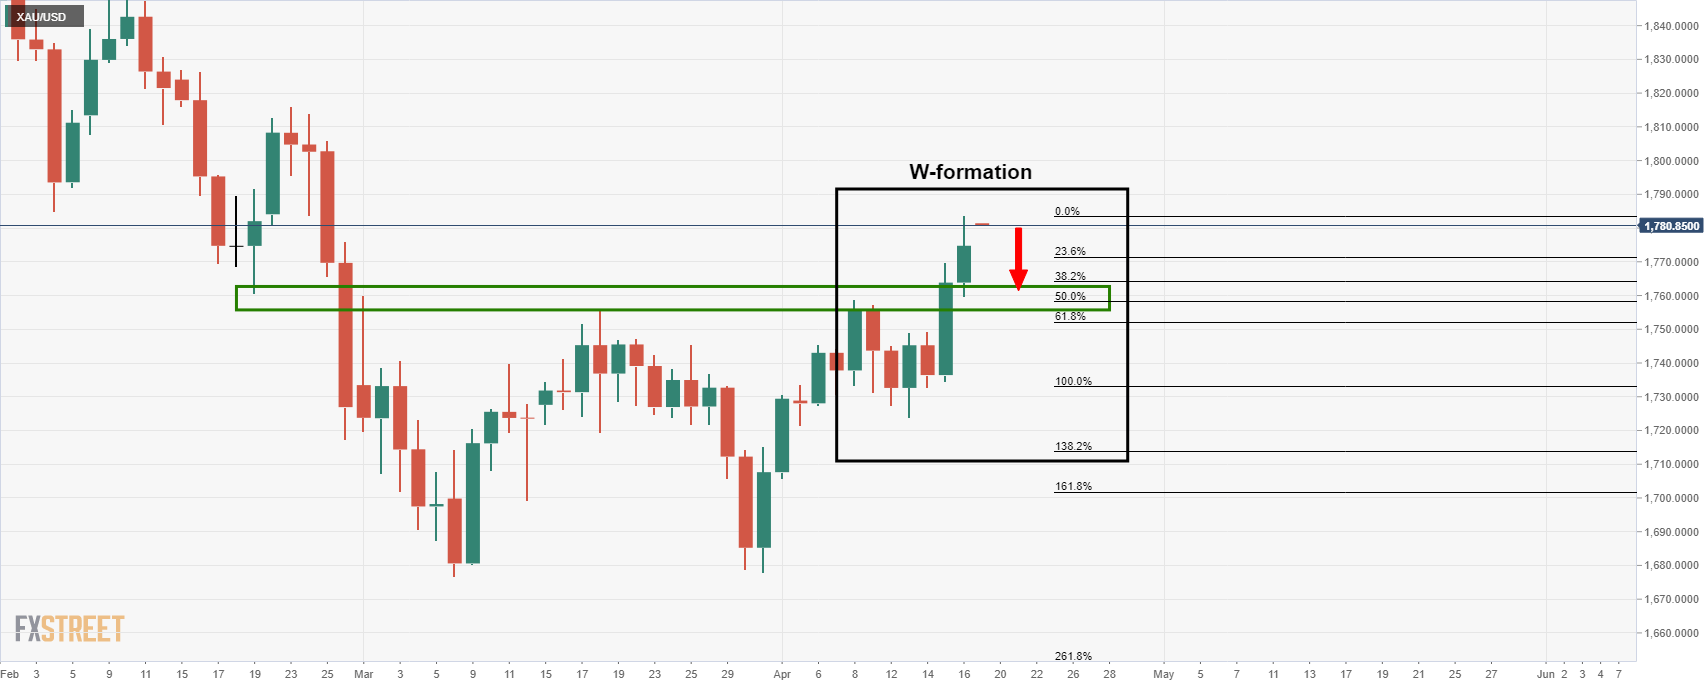
A deeper 62% retracement will meet with the 21-day EMA and the neckline of the W-formation.
Live market, daily & 4-hour charts
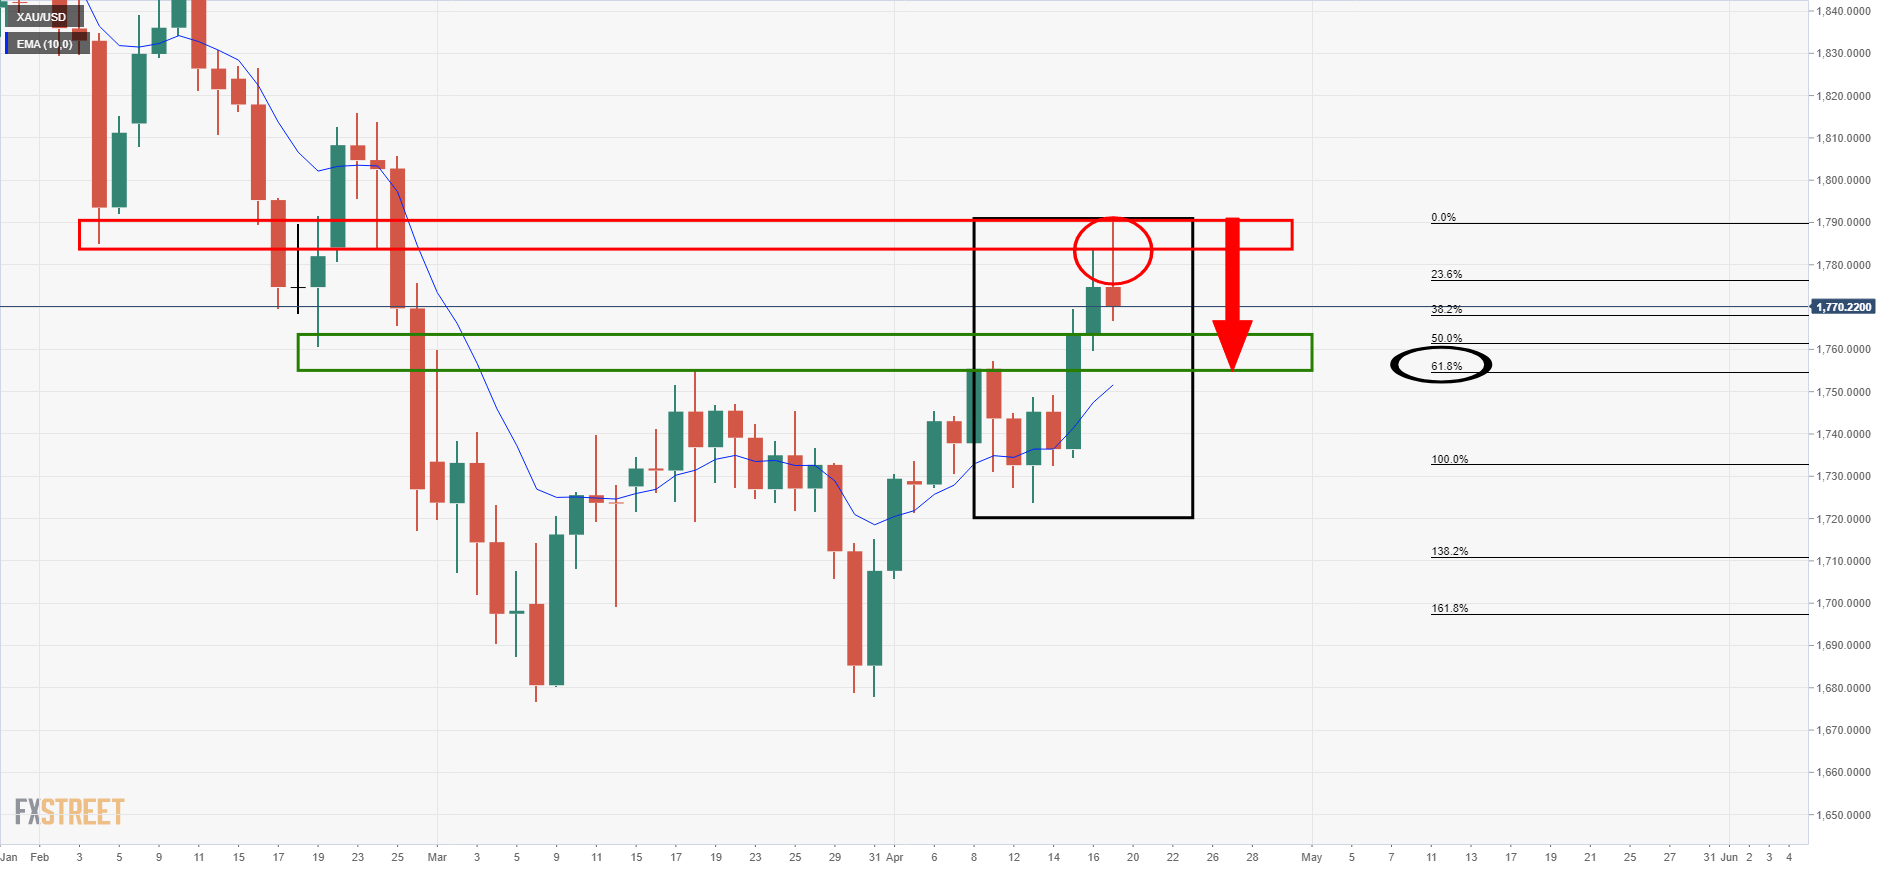
There has been a strong rejection of the $1,790 area which reinforces the downside bias towards the old resistance area that would be expected to act as new support.
There is now a perfect confluence with the 61.8% Fibonacci level as well.
Crucially, from a 4-hour perspective, a new resistance structure has been formed:
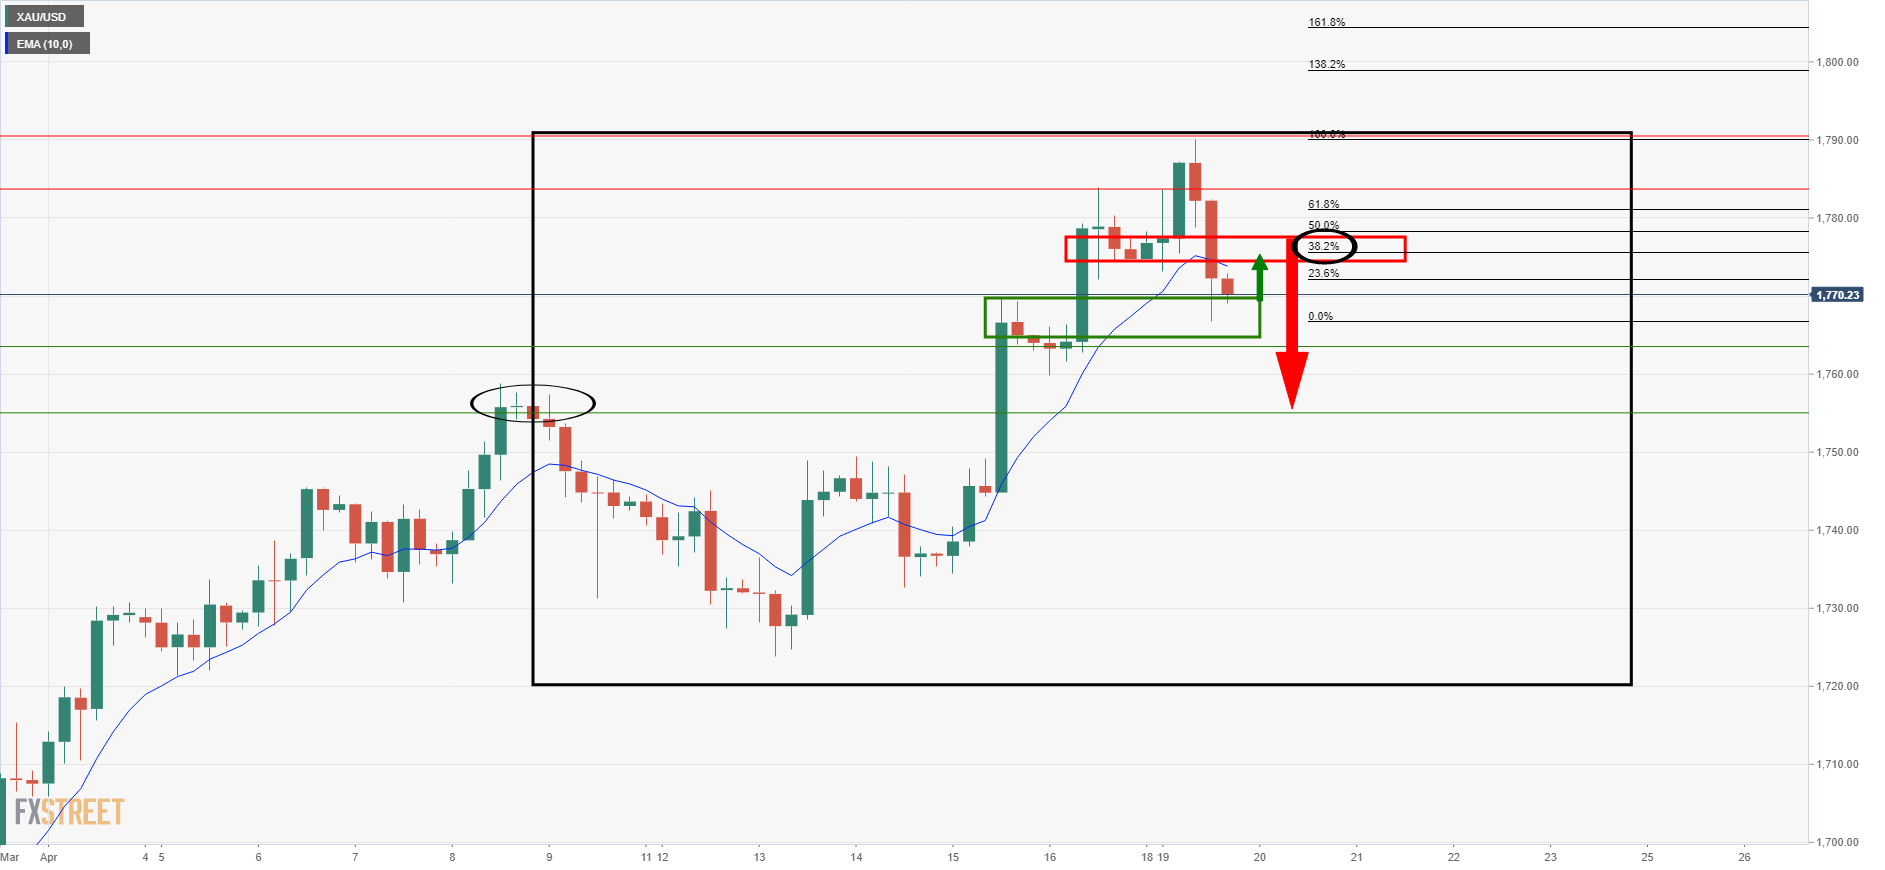
There are prospects of a retest of the resistance structure and a confluence of the 38.2% Fibonacci retracement of the recent bearish impulse.
A restest and failure would be expected to act as a catalyst to the next downside leg towards the prior daily resistance.
