- Gold is down more than $25 from Tuesday’s 7.5-year high.
- Short duration technical charts suggest scope for further decline toward a rising trendline support.
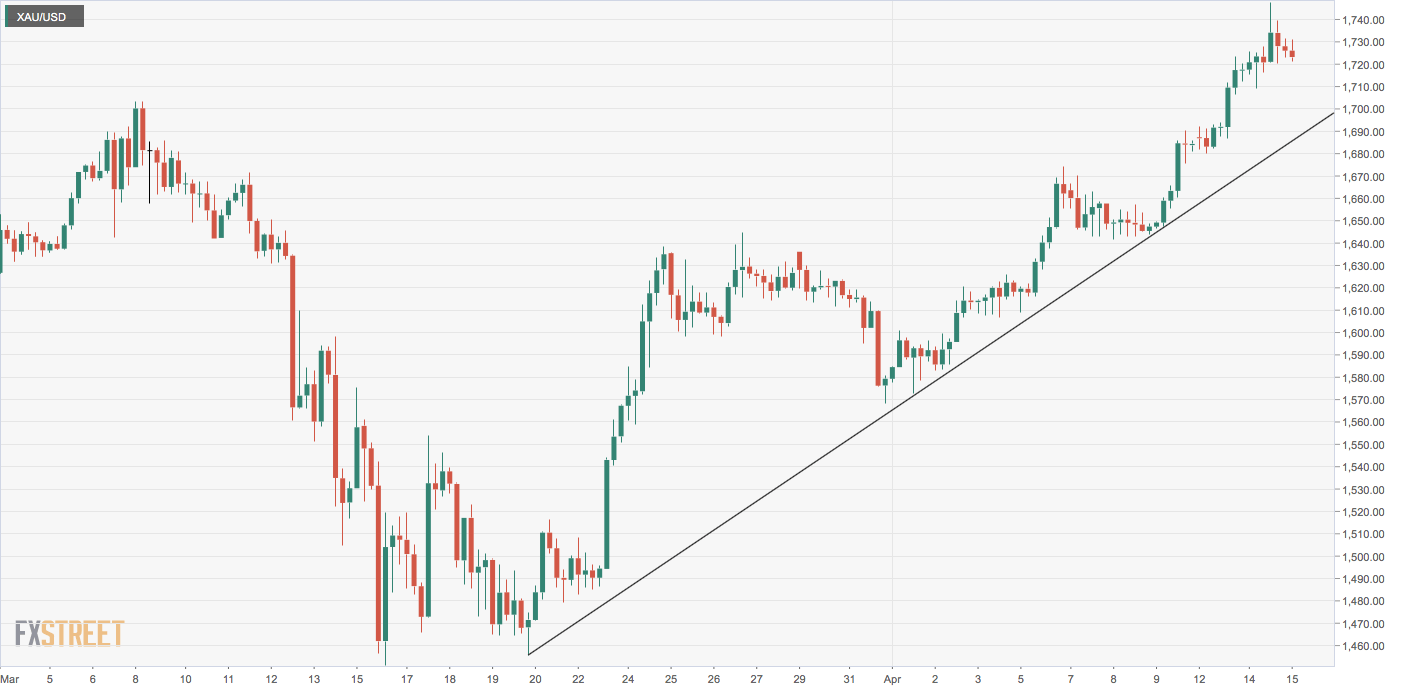
Gold is extending the overnight pullback from 7.5-year highs and risks falling to the support of the trendline connecting from March 19 and April 9 lows.
The yellow metal is currently trading near $1,722 per ounce, representing a 0.35% loss on the day, having hit a high of $1,748 on Tuesday. That level was last seen in November 2012.
The metal could slide further to the ascending trendline support, currently at $1,690, as the 4-hour chart is reporting a bearish doji reversal pattern and a bearish divergence of the relative strength index.
On the way lower, the precious metal could encounter support of the 50-hour average placed at $1,712. If the average support holds ground, a fresh bounce to levels above $1,720 may be seen.
The short-term bullish bias would be invalidated if prices print two consecutive daily closes under the former seven-year high of $1,703 reached in March.
Hourly chart
Trend: Pullback likely
Technical levels
