Gold (XAU/USD) is rejoicing another leg higher, sitting at the highest levels in nine days above $1960. Gold benefits from the US dollar weakness, as the greenback breaks lower on the return of the risk appetite, thanks to the stronger Chinese activity numbers and US-Sino trade optimism. Looming Brexit risks also add to boost the safe-haven appeal of gold.
Coronavirus vaccine hopes will continue to bode well for global equities at the expense of the dollar, which is likely to render gold supportive. Let’s take a look at whether gold’s charts?
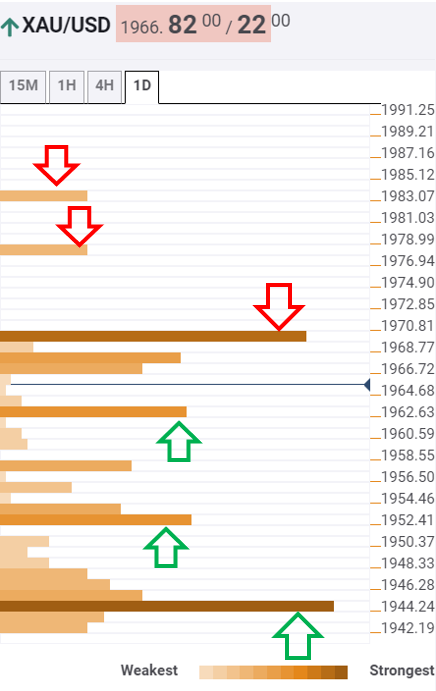
Gold: Key resistances and supports
The Technical Confluence tool shows that gold is on the verge of recapturing the robust barrier at $1969, which is the convergence of the pivot point one-week R1 and Bollinger Band 15-minutes Upper.
Alternatively, plenty of healthy support levels are likely to limit any retracements, with the immediate cushion aligned at $1962, the intersection of the previous day high, SMA200 four-hour and Bollinger Band four-hour Upper.
Sellers will then challenge minor support at $1957, where the Fibonacci 23.6% one-day and SMA5 four-hour coincide.
Further south, the Fibonacci 23.6% one-week level at $1951 will get tested. A break below which a dense cluster of support levels is seen around $1947.
The downside target of $1945 is the level to beat for the bears. That level is the Fibonacci 38.2% one-week.
Here is how it looks on the tool
About the Confluence Detector
The TCI (Technical Confluences Indicator) is a tool to locate and point out those price levels where there is a congestion of indicators, moving averages, Fibonacci levels, Pivot Points, etc. Knowing where these congestion points are located is very useful for the trader, and can be used as a basis for different strategies.
Learn more about Technical Confluence
