Gold has been recovering from the lows and found some calm as US traders are off for Martin Luther King Day. The current stability could be the calm before the next storm around January 20. President-elect Joe Biden is set to enter the White House and kick off his term with a flurry of Executive Orders, on top of pushing the $1.9 trillion fiscal stimulus plan he already presented.
How is XAU/USD positioned on the technical graphs?
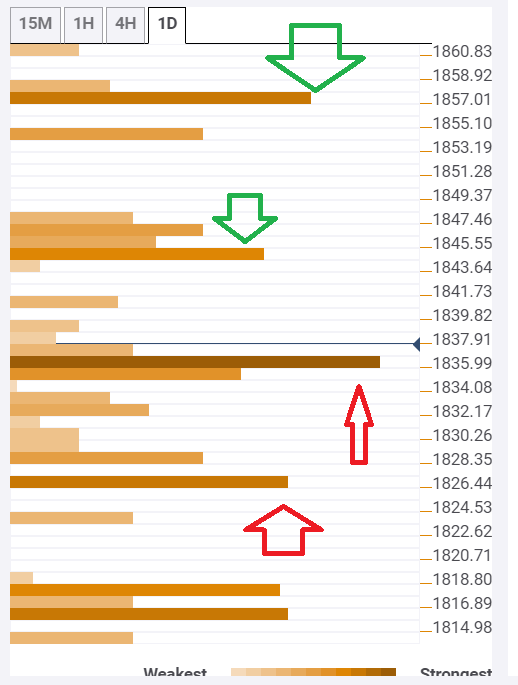
The Technical Confluences Indicator is showing that the precious metal is hovering above $1,836, which is a strong support line. It is the convergence of the Simple Moving Average 5-1h, the SMA 5-15m, the Bollinger Band 15min-Middle, and the Fibonacci 38.2% one-week.
The next cushion is at $1,826, which is where the Fibonacci 61.8% one-month and the Fibonacci 23.6% one-week.
Resistance is at $1,844, which is the confluence of the 200-day SMA and the Fibonacci 61.8% one-day.
Further above, $1,857 is the upside target. It is the juncture of the previous daily high and the Fibonacci 38.2% one-month.
XAU/USD resistance and support levels
Confluence Detector
The Confluence Detector finds exciting opportunities using Technical Confluences. The TC is a tool to locate and point out those price levels where there is a congestion of indicators, moving averages, Fibonacci levels, Pivot Points, etc. Knowing where these congestion points are located is very useful for the trader, and can be used as a basis for different strategies.
Learn more about Technical Confluence
