- Gold stays depressed near 8.5-month low, recently bounced off intraday bottom.
- Oversold RSI probes sustained trading below six-week-old resistance, previous support.
- 61.8% Fibonacci retracement, falling trend line from August lure gold bears.
Gold struggles to carry the uptick from an intraday low of $1,707, also the lowest since mid-June 2020, while taking rounds to $1,713, down 0.62% on a day, during early Tuesday.
In doing so, the yellow metal drops for the sixth day in a row while extending the downside break of a descending support line from January 18.
Although RSI conditions keep testing gold sellers, a sustained break of the previous key support directs the bullion further towards the south.
In doing so, the $1,700 becomes the immediate support ahead of a 61.8% Fibonacci retracement level of March-August 2020 upside, near $1,688. If at all the metal bears refrain from stepping back near $1,688, a downward sloping trend line from August 12, at $1,682 now, will be the key to watch.
On the contrary, the previous support line, currently around $1,756, precedes 50% of the Fibonacci retracement near $1,763 to test the commodity’s corrective pullback.
Though, the bulls will wait for a clear break of a two-month-old resistance line, at $1,800 now, for fresh entries.
Gold daily chart
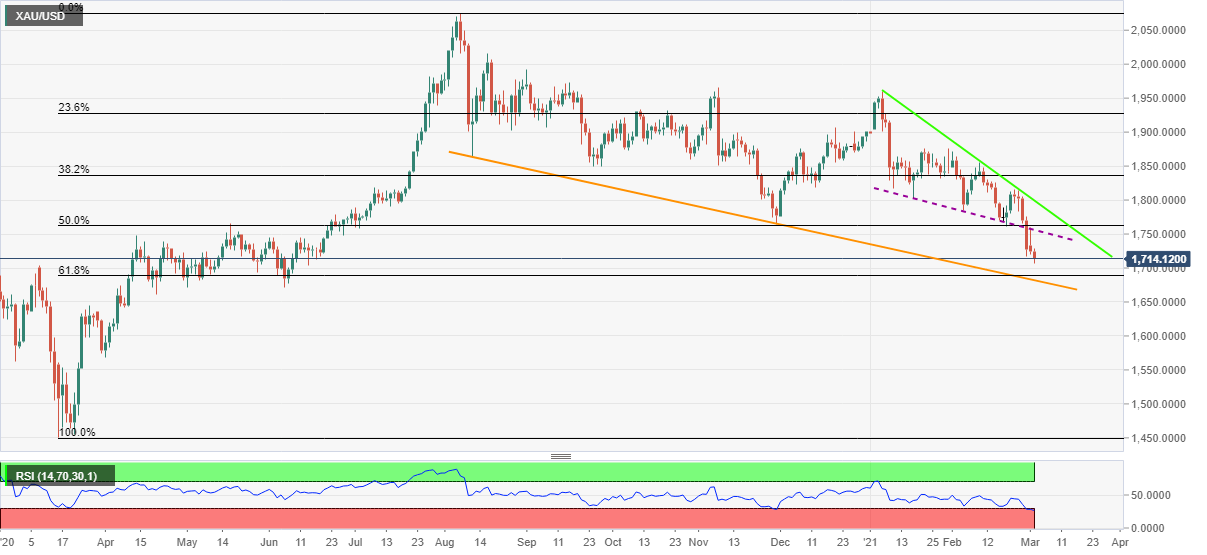
Trend: Bearish
