The safe-haven US dollar is on the rise, benefiting from concerns about the strength of the US economy. The rush to cash is sucking away funds from other assets, including gold, pushing the precious metal down from hugging the $1,850 level.
How is XAU/USD positioned on the technical graphs?
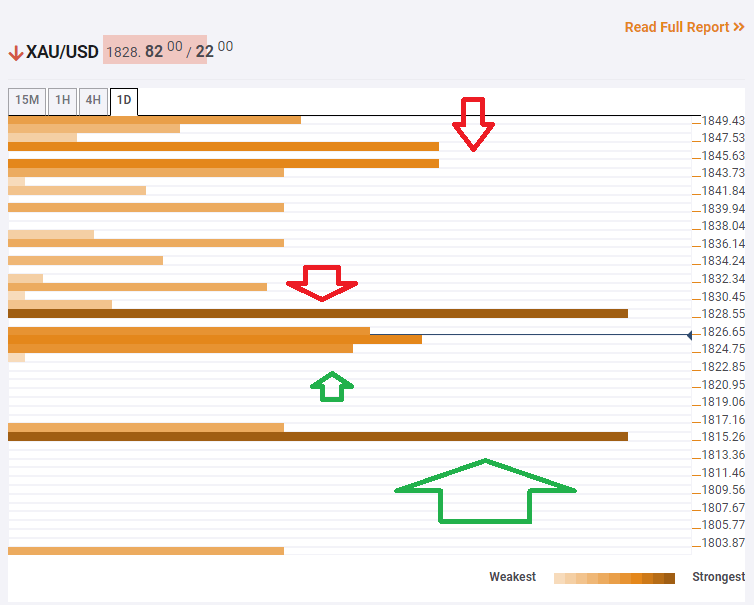
The Technical Confluences Indicator is showing that weak support awaits at around $1,823, which is the convergence of the Bollinger Band one-day Lower and the Fibonacci 61.8% one-month.
A critical cushion is at $1,815, which is the meeting point of the Pivot Point one-month Support 1 and the PP one-day S2.
Immediate resistance is at $1,828, which is a juncture including the BB 15min-Lower and the previous weekly low.
Looking up, $1,845 is the upside target, where the 200-day SMA and the Fibonacci 61.8% one-day converge.
XAU/USD resistance and support levels
Confluence Detector
The Confluence Detector finds exciting opportunities using Technical Confluences. The TC is a tool to locate and point out those price levels where there is a congestion of indicators, moving averages, Fibonacci levels, Pivot Points, etc. Knowing where these congestion points are located is very useful for the trader, and can be used as a basis for different strategies.
Learn more about Technical Confluence
