- Gold has tumbled down on Thursday amid a risk-off mood.
- The Confluence Detector shows the precious metal may fall to $1,857 and is capped at $1,878.
- Gold prices pull back as traders book profits – What’s next? [Video]
This is not the breakout gold bulls were hoping for – after “hugging” the $1,900 level for long sessions, XAU/USD broke sharply to the downside. A trio of upbeat US figures – ADP’s jobs report, unemployment claims and the ISM Manufacturing Purchasing Managers’ Index raised the specter of an early tapering from the Federal Reserve. If the Fed prints fewer dollars, gold has less support.
The next big event is the Nonfarm Payrolls – full preview – but until then, technical positioning is in place.
Where next for gold from here?
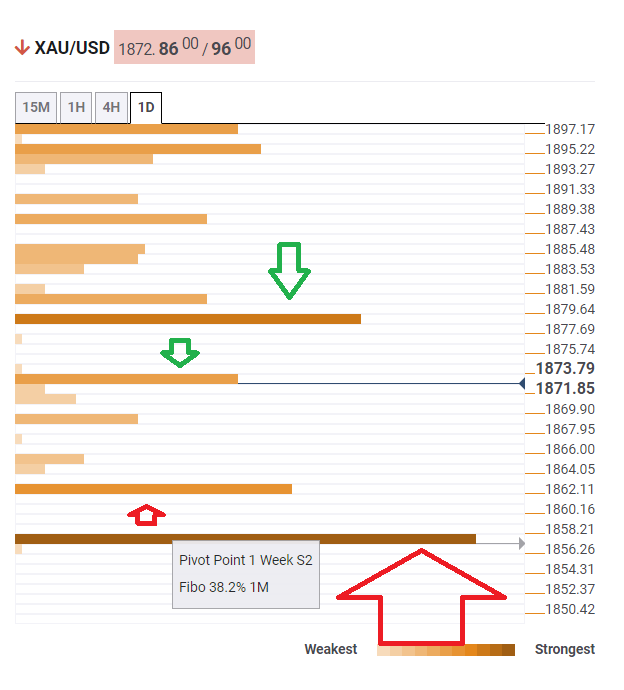
The Technical Confluences Detector is showing that XAU/USD is battling the $1,872 level, which is the convergence of the previous weekly low, the Bollinger Band 1-min Middle and the Simple Moving Average 5-15m.
If gold wins this battle, the immediate upside target is $1,878, which is the meeting point of the SMA 100-4h and the Fibonacci 23.6% one month.
Looking down, soft support awaits at $1,862, which is the confluence of the BB 1h-Lower and the previous 4h-low.
A critical cushion awaits at $1,857, which is where the Pivot Point one-week Support 2 and the Fibonacci 38.2% one-month converge.
XAU/USD resistance and support levels
Confluence Detector
The Confluence Detector finds exciting opportunities using Technical Confluences. The TC is a tool to locate and point out those price levels where there is a congestion of indicators, moving averages, Fibonacci levels, Pivot Points, etc. Knowing where these congestion points are located is very useful for the trader, and can be used as a basis for different strategies.
Learn more about Technical Confluence
