Gold (XAU/USD) is retreating from five-week highs, as the US dollar finds its feet amid a downbeat market mood. Growing concerns over the covid surge and vaccine side-effects dent the risk sentiment, lifting the haven demand for the greenback. Stronger US jobs data also continue to buoy the dollar.
Meanwhile, the US Treasury yields are stabilizing after a dovish blow from the FOMC minutes and Fed Chair Powell’s comments. Looking ahead the dynamics in the yields and dollar will continue to have a significant influence on gold prices.
Let’s take a look at how gold is positioned on the technical graphs.
Gold Price Chart: Key resistance and support levels
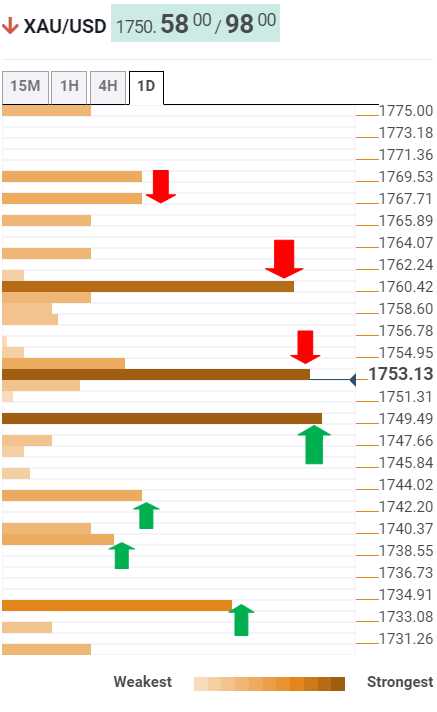
The Technical Confluences Detector shows that gold is extending its retreat after facing rejection at the critical resistance at $1761, the confluence of the previous day high, Bollinger Band one-day Upper and the previous month high.
The XAU sellers then found acceptance below the $1754 support now resistance, where the SMA5 four-hour coincides with the Fibonacci 23.6% one-day.
The next relevant support awaits at $1750; the intersection of the Fibonacci 38.2% one-day and pivot point one-week R1.
Further down, the Fibonacci 61.8% one-day at $1743 could protect the XAU buyers, below which the pivot point one-day S1 and SMA5 one-day around $1739 will get tested.
The convergence of the previous day low and the previous week high at $1735 could challenge the bearish commitments.
Alternatively, the bulls need acceptance above the $1761 barrier to unleash further upside towards the Fibonacci 161.8% one-week at $1767.
Here is how it looks on the tool
About Technical Confluences Detector
The TCD (Technical Confluences Detector) is a tool to locate and point out those price levels where there is a congestion of indicators, moving averages, Fibonacci levels, Pivot Points, etc. Knowing where these congestion points are located is very useful for the trader, and can be used as a basis for different strategies.
