- Gold is on the verge of an upside extension on a break of weekly resistance.
- The bulls are stepping in at a 50% mean reversion on the daily impulse.
XAU/USD is making progress with respect to the bullish market structure following a period of consolidation in recovery of the daily correction.
The following is a top down analysis that illustrates the bullish bias.
Monthly chart
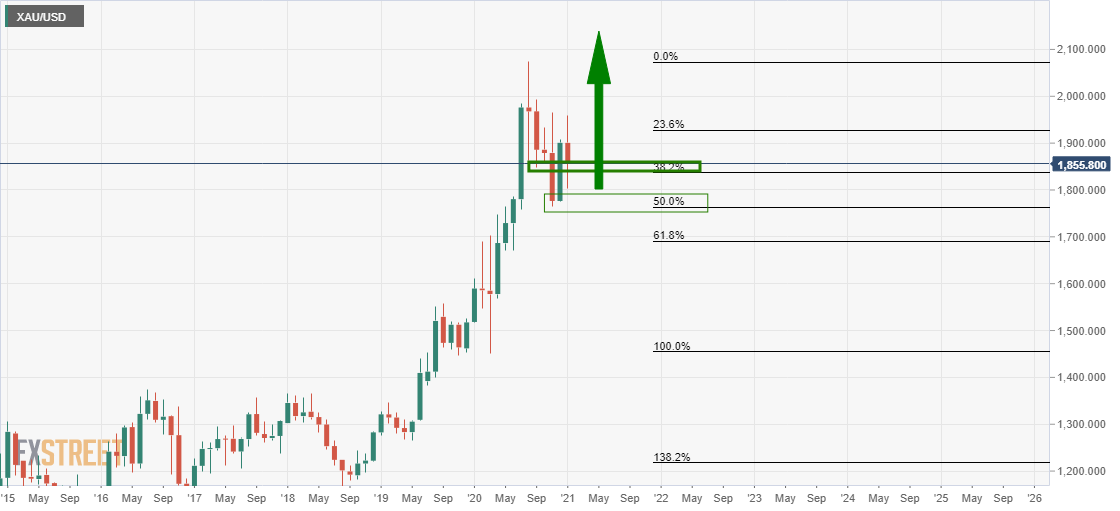
The monthly chart would be expected to continue higher following the rally from a 50% mean reversion of the monthly bullish impulse.
Weekly chart
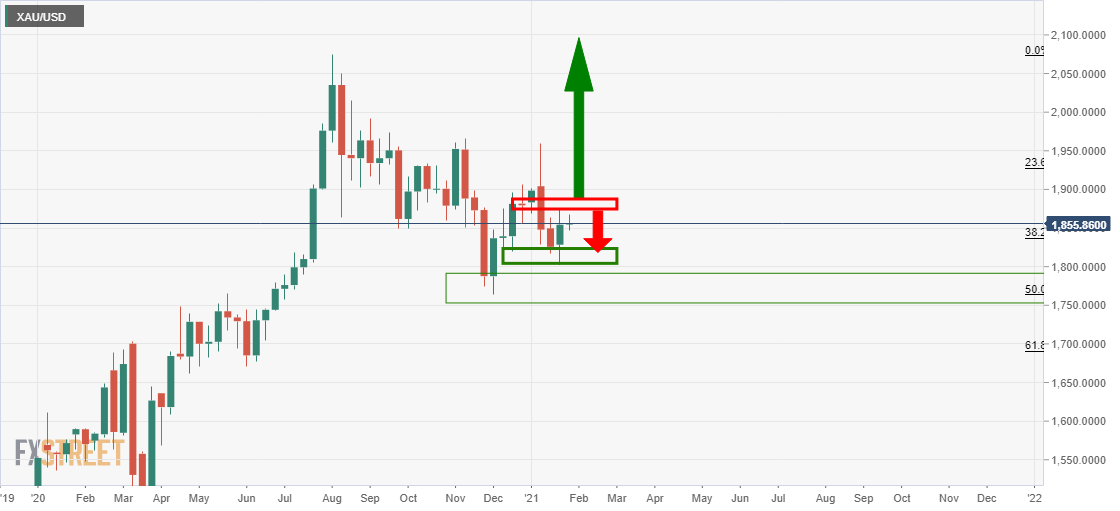
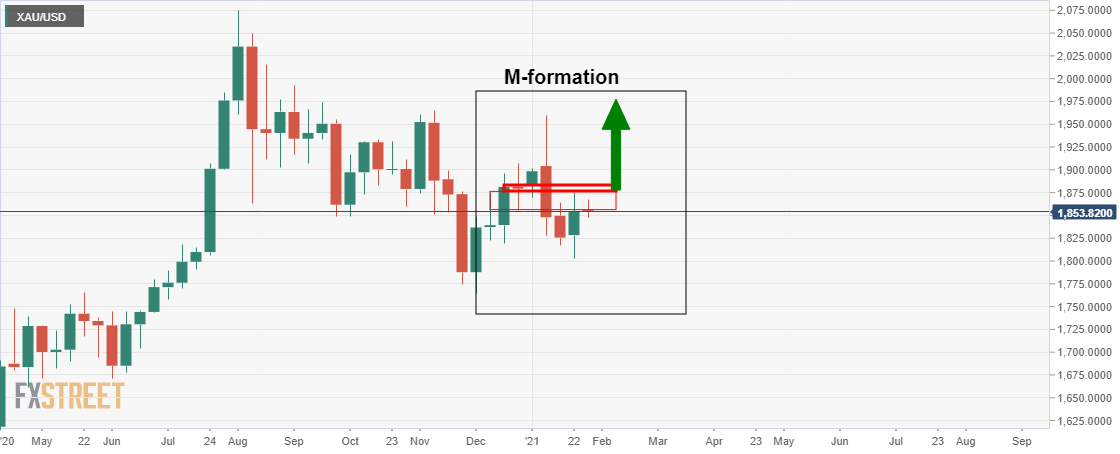
The market is on the verge of a test of the weekly M-formation’s neckline resistance. If the resistance holds, the focus will be back on the downside to the current support.
Daily chart
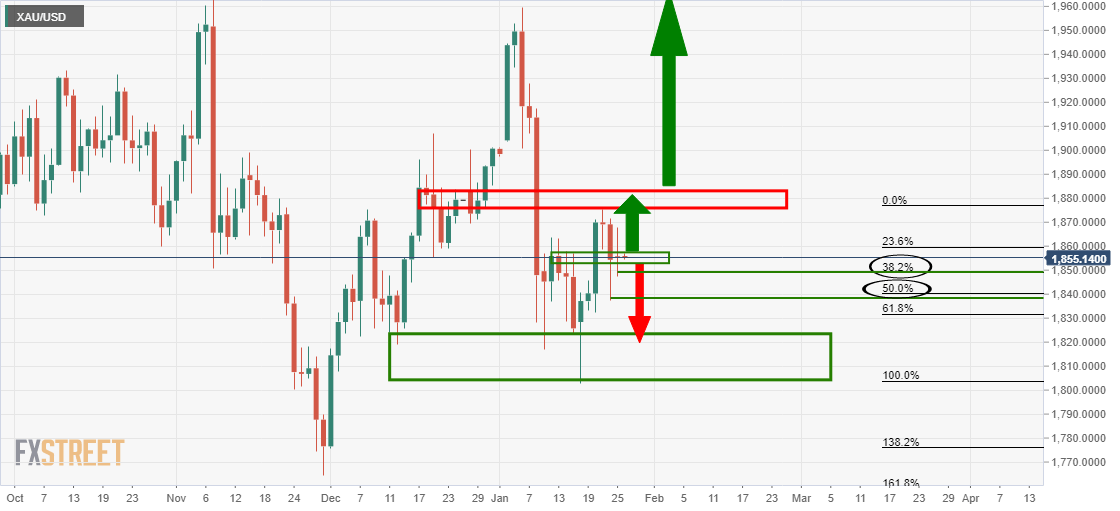
Following a retracement, a continuation can be expected.
In this particular case, we have seen a 50% mean reversion followed by a higher low and demand at the 38.2% Fibo which is bullish.
