- Gold prices remain positive near the record high of $1,945.22 flashed the previous day.
- Rising wedge, bearish MACD on the hourly chart suggest pullback.
- 50-hour EMA, weekly support line add to the downside support.
Gold prices take rounds to $1,942 amid the early Tuesday morning in Asia. The bullion marked fresh record high on Monday but bulls catch a breather afterward. This joins bearish MACD signals and a rising wedge pattern on the hourly chart to mark the curious case of a gold trader.
While a break of $1,934 will confirm a short-term bearish chart pattern, a confluence of 50-hour EMA and an upward sloping trend line from July 22, around $1,917, could challenge the sellers.
Though, a clear break below $1,917 will not hesitate to attack July 23 top near $1,898 that holds the key to the precious metal’s further weakness towards $1,863, low of last Thursday.
On the upside, the upper line of the rising wedge surrounding $1,946, followed by $1,950 round-figure, might entertain the bulls during the further rise.
However, major attention is on the $2,000 psychological magnet ahead of the 61.8% Fibonacci expansion of the quote’s run-up from mid-2001 to late-2011, around $2,077.
Gold hourly chart
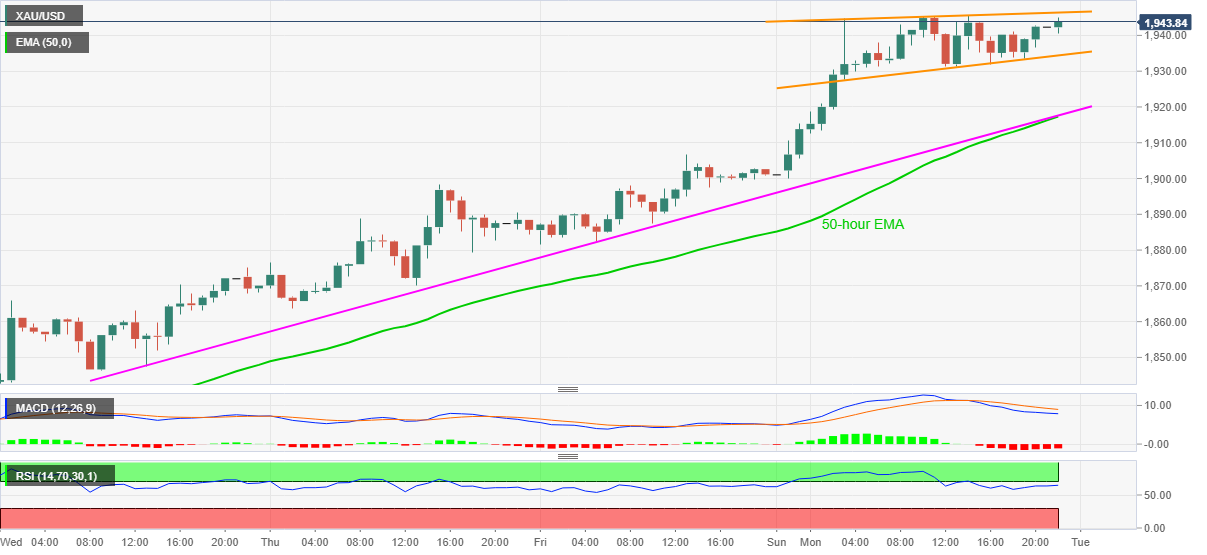
Trend: Pullback expected
