- XAU/USD is posting strong gains following Monday’s choppy session.
- A daily close above $1,900 could open the door for additional gains.
- 10-year US Treasury bond yield is losing more than 2% on the day.
Update: Gold (XAU/USD) bulls catch a breather around $1,900, recently easing to $1,898.72, following a notable rise to refresh multi-day high, during the initial Asian session on Wednesday. The slump in the US dollar index (DXY) and the US 10-year Treasury yield, respectively to fresh lows since January and late April in that order, seem to have propelled the gold price rally the previous day. Also on the same side could be the market’s indecision over the reflation risk and tapering concerns even as the US Federal Reserve (Fed) officials tried to placate pessimism. Additionally, mixed data and cautious sentiment ahead of Friday’s US Core Personal Consumption Expenditure – Price Index, the Fed’s preferred gauge of inflation, also contribute to the market’s indecision and put a safe-haven bid under gold.
While inflation and the Fedspeak could keep entertaining the gold traders, bulls need to stay beyond late January tops surrounding $1,875 to keep the reins. Alternatively, the $1,900 psychological magnet and $1,910 may act as immediate upside hurdles ahead of October 2020 peak near $1,933.
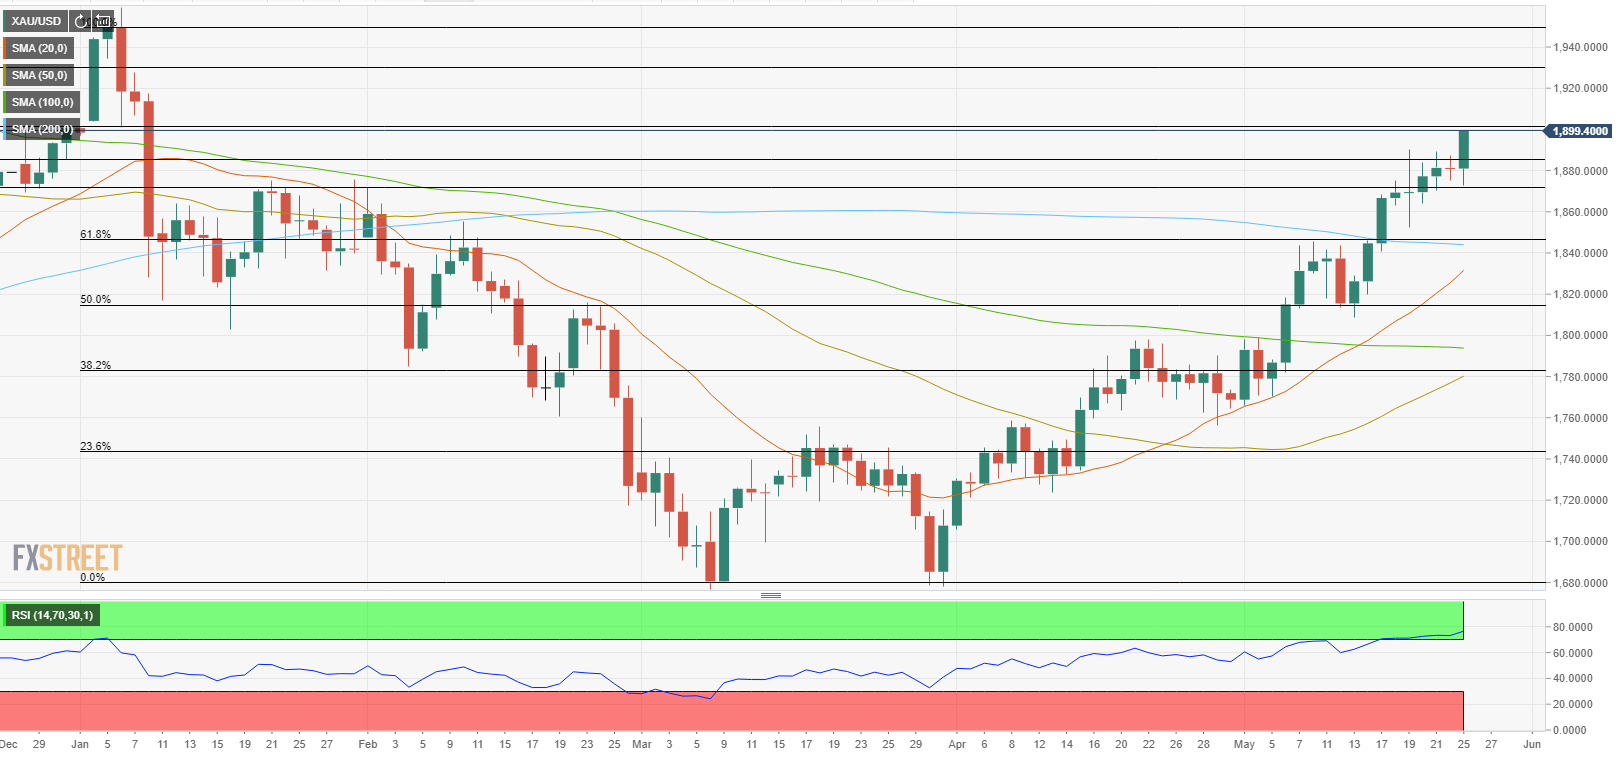
The XAU/USD pair started the new week in a relatively calm manner and closed virtually unchanged on Monday. With US Treasury bond yields falling sharply on Tuesday, gold regained its traction and touched its highest level since early January at $1,898. As of writing, XAU/USD was trading at $1,897, rising 0.8% on a daily basis.
Gold continues to react to T-bond yields
The data from the US revealed on Tuesday that the Conference Board’s Consumer Confidence Index edged lower to 117.2 in May from 117.5 in April. This reading missed Reuters’ estimate of 119.2 but failed to trigger a meaningful market reaction.
Federal Reserve’s Vice Chairman Richard Clarida noted on Tuesday that April’s Consumer Price Index (CPI) number, which arrived at 4.2% on a yearly basis, was a “very unpleasant surprise.” Clarida further added that policymakers could start discussing scaling back purchases depending on the data flow.
Meanwhile, commenting on the inflation outlook, “it is my view and the Fed’s general view that inflation pressures are most likely to be transitory,” Federal Reserve’s Vice Chairman for Supervision Randal Quarles said.
Market participants largely ignored these remarks and the benchmark 10-year US Treasury bond yield, which closed the previous three trading days in the negative territory, extended its slide and was last seen losing 2.3% at 1.567%.
Gold technical outlook
On the daily chart, the Relative Strength Index (RSI) indicator continues to inch higher toward 80, suggesting that the pair remains technically overbought. If buyers struggle to carry the price above $1,900 (psychological level), profit-taking could trigger a near-term correction. The initial support could be seen at $1,885 (static level) ahead of $1,872 (May 25 low). Below the latter, the 200-day SMA forms significant dynamic support around $1,845.
On the upside, additional gains are likely if gold makes a daily close above $1,900 and confirms that level as support. $1,930 (static level) could be seen as the next target.
Additional levels to watch for
