- XAU/USD failed to make a decisive move in either direction this week.
- $1,925 aligns as a critical support for gold.
- The descending triangle on the daily chart points out to a bearish outlook.
The troy ounce of the precious metal fluctuated in a relatively tight range throughout the week and closed with a gain of $10 at $1,950.
Gold technical outlook
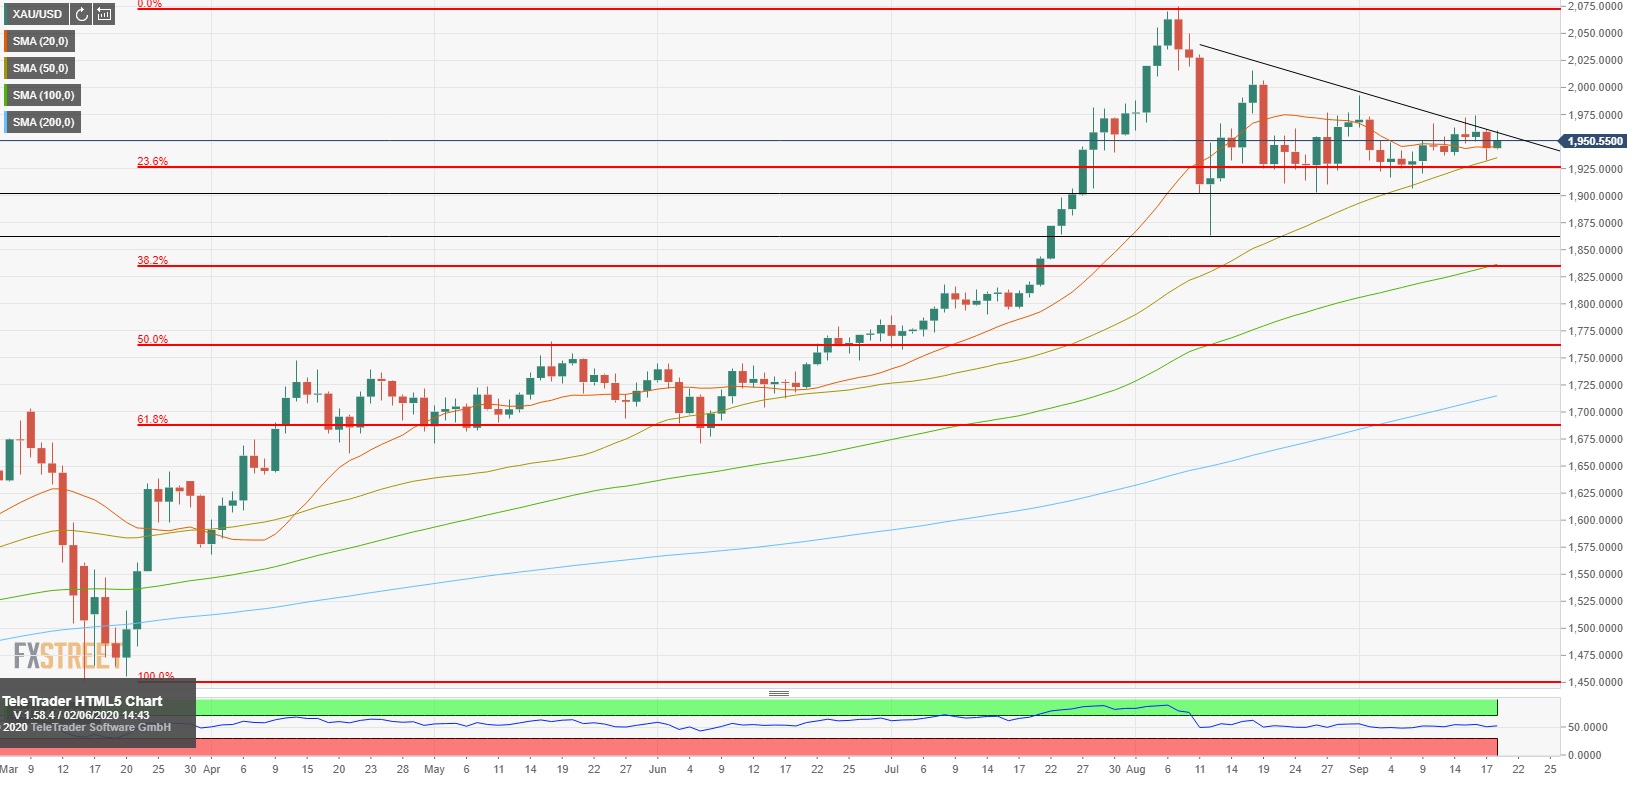
$1,925, Fibonacci 23.6% retracement of the uptrend that started in late March and ended in early August, has been tested numerous times in the past few weeks and seems to be holding bears in check. However, the descending triangle, which is a bearish pattern, that can be seen on the daily chart is using that static support area as its bottom. Additionally, the 50-day SMA is staying relatively close to that level, confirming its significance. With a daily close below $1,925, XAU/USD could extend its slide toward $1,900(psychological level/ Aug. 26 low) and $1,860 (Aug. 12 low).
On the upside, the near-term outlook could turn bullish with a decisive break through $2,000 (psychological level). Ahead of that level, $1,975 (Sep. 16 high) could be seen as an interim resistance.
Gold chart (daily)