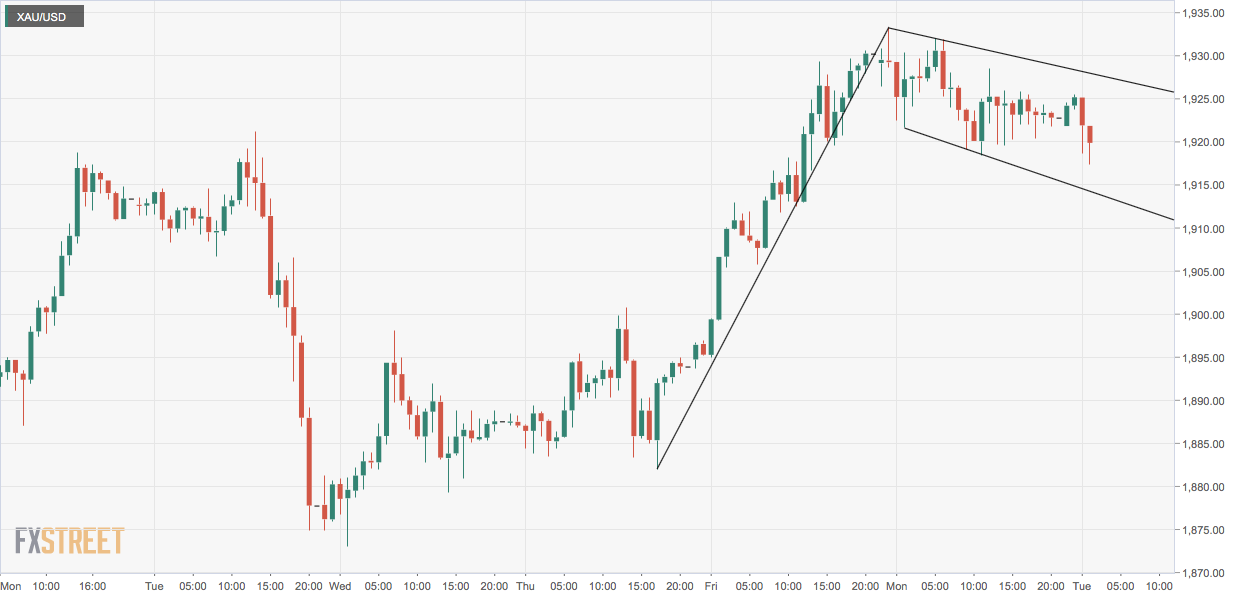
- Gold’s hourly chart shows a bull flag, a continuation pattern.
- A breakout will likely accelerate the broader uptrend.
Gold is currently trading 0.21% lower on the day at $1,918 per ounce, having declined by 0.35% on Monday.
The pullback from $1,933 to $1,918 has taken the shape of a bull flag on the hourly chart.
A breakout would imply a rally resumption from the Oct. 8 low of $1,881 and open the doors to $1,980 (target as per the measured move method).
Alternatively, a flag breakdown would shift risk in favor of a drop to the psychological support of $1,900.
For now, the metal is trading in the red, tracking the strength in the greenback. The dollar index, which gauges the dollar’s strength against majors, has increased from 93.00 to 93.18 alongside a $0.3% decline in the S&P 500 futures.
Hourly chart
Trend: Neutral
Technical levels
