- Gold is posting strong gains on the first day of the week.
- Next technical resistance could be seen at $1,835.
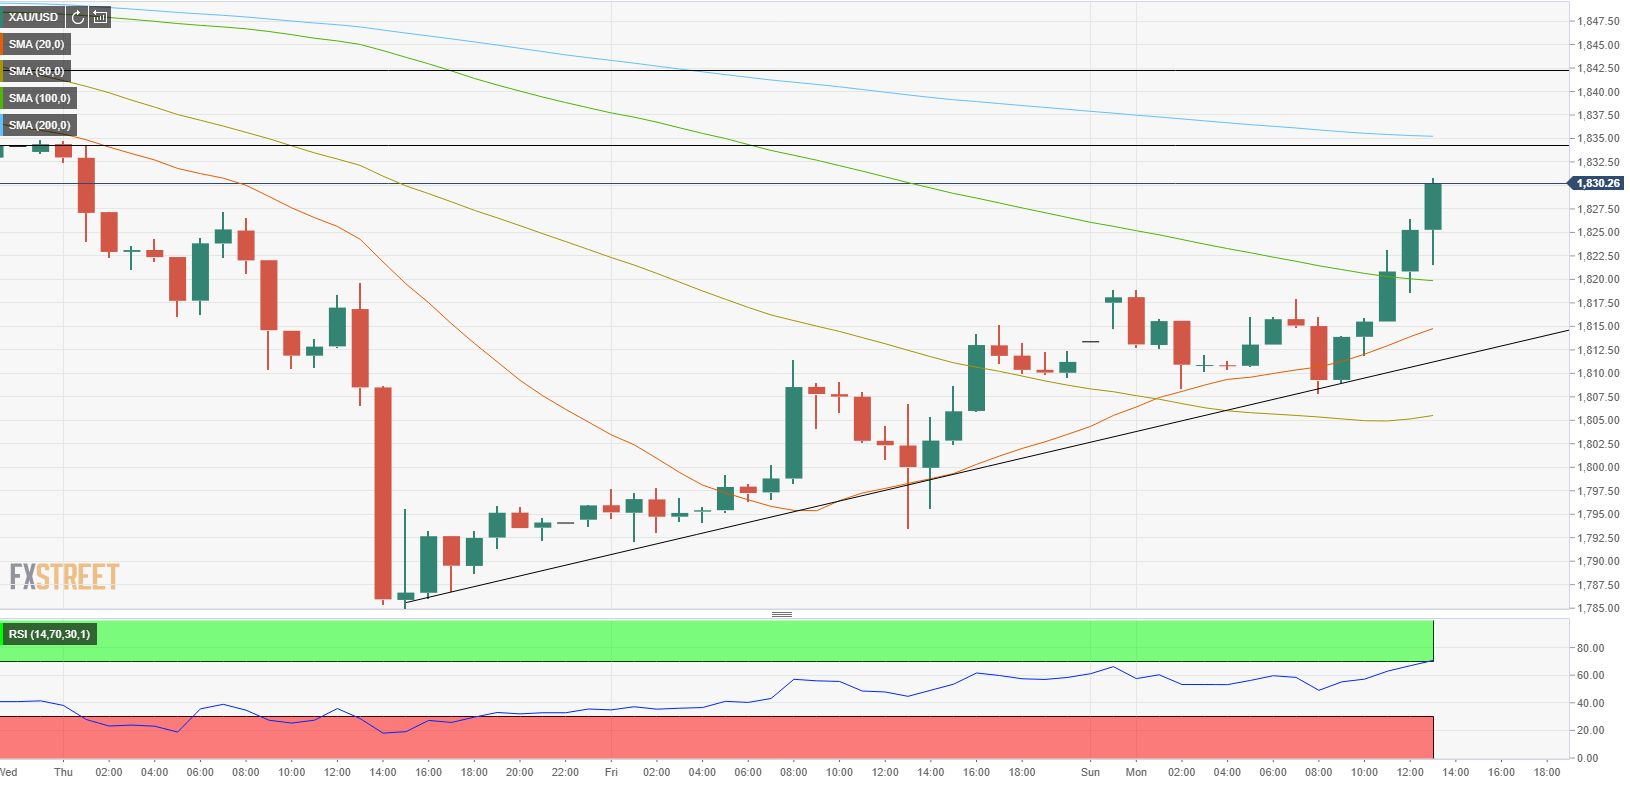
- Ascending trend line on one-hour chart acts as dynamic support.
The XAU/USD pair started the new week with a small bullish gap but stayed relatively quiet during the Asian trading hours. However, the pair regained its traction ahead of the American session and touched a daily high of $1,830.80. As of writing, XAU/USD was up 0.9% on the day at $1,830.40.
Gold technical outlook
On the one-hour chart, the gold price seems to be following an ascending trend line since the sharp drop witnessed last Thursday. However, the Relative Strength Index (RSI) on the same chart has reached the overbought area at 70 for the first time since January 29, suggesting that there could be a near-term technical correction before the next leg up.
Nevertheless, unless the trend line, currently located around $1,815, is violated, buyers are likely to remain in control of the price action. Ahead of that level, the 100-SMA is interim support at $1,820.
On the upside, there are two horizontal levels that could act as resistance at $1,835, which also reinforced by the 200-SMA, and $1,842.
Gold one-hour chart