- XAU/USD recorded its largest weekly decline since 1983 last week.
- Further downside could be on the cards.
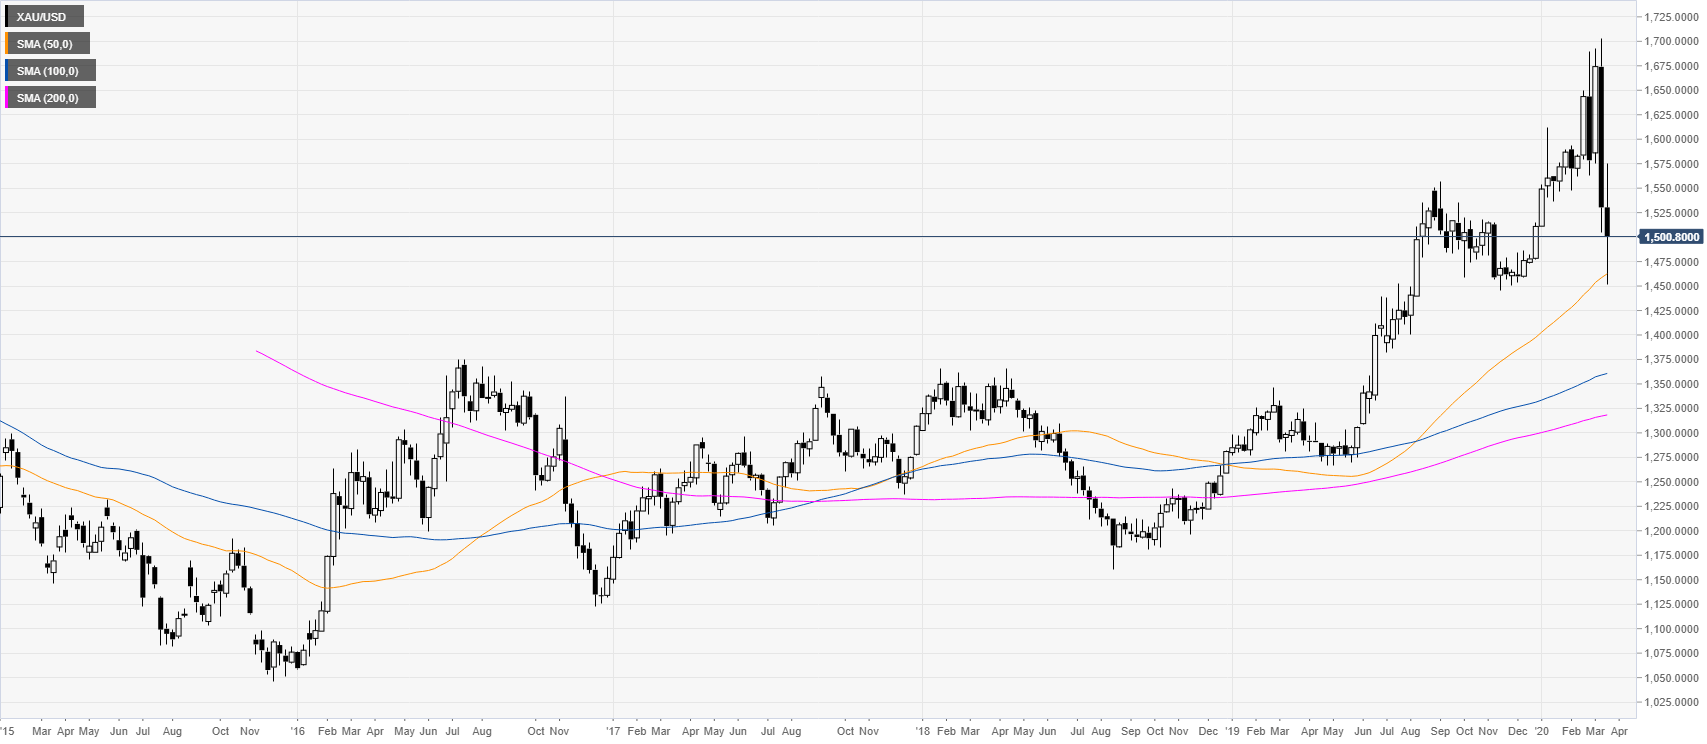
XAU/USD weekly chart
Gold suffered its worst weekly decline since 1983 last week, erasing the 2020 gains and challenging the 50 SMA on the weekly chart.
XAU/USD daily chart
The market remains on the back foot with extreme volatility while testing the 1500 mark and the 200 SMA on the daily chart. Gold stays vulnerable but bears need to overcome the 1480 support on a daily basis to reach 1440 on the way down. Resistance can be expected near 1530 and in the 1548/1557 price zone.
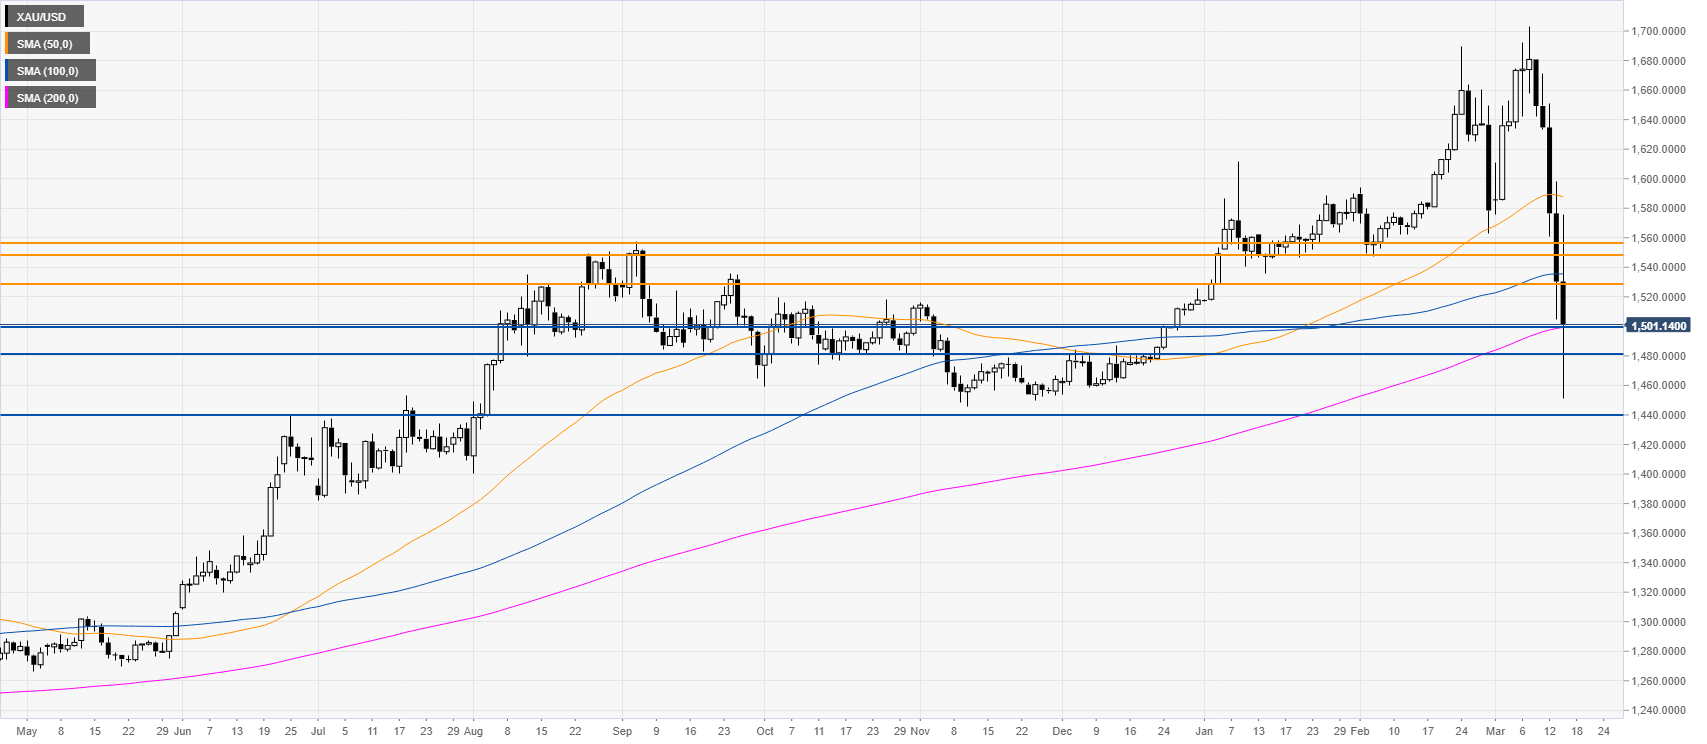
Resistance: 1530, 1548, 1557
Support: 1500, 1480, 1440
Additional key levels
