- Gold is fluctuating in a very tight range on Friday.
- XAU/USD could push higher if it manages to break above 200-SMA on H4 chart.
- Key support for gold is located at $1,817.
The XAU/USD pair registered small daily gains on Thursday but struggled to extend its recovery amid a lack of significant fundamental drivers on Friday. As of writing, the pair was up 0.15% on a daily basis at $1,849.
Gold technical outlook
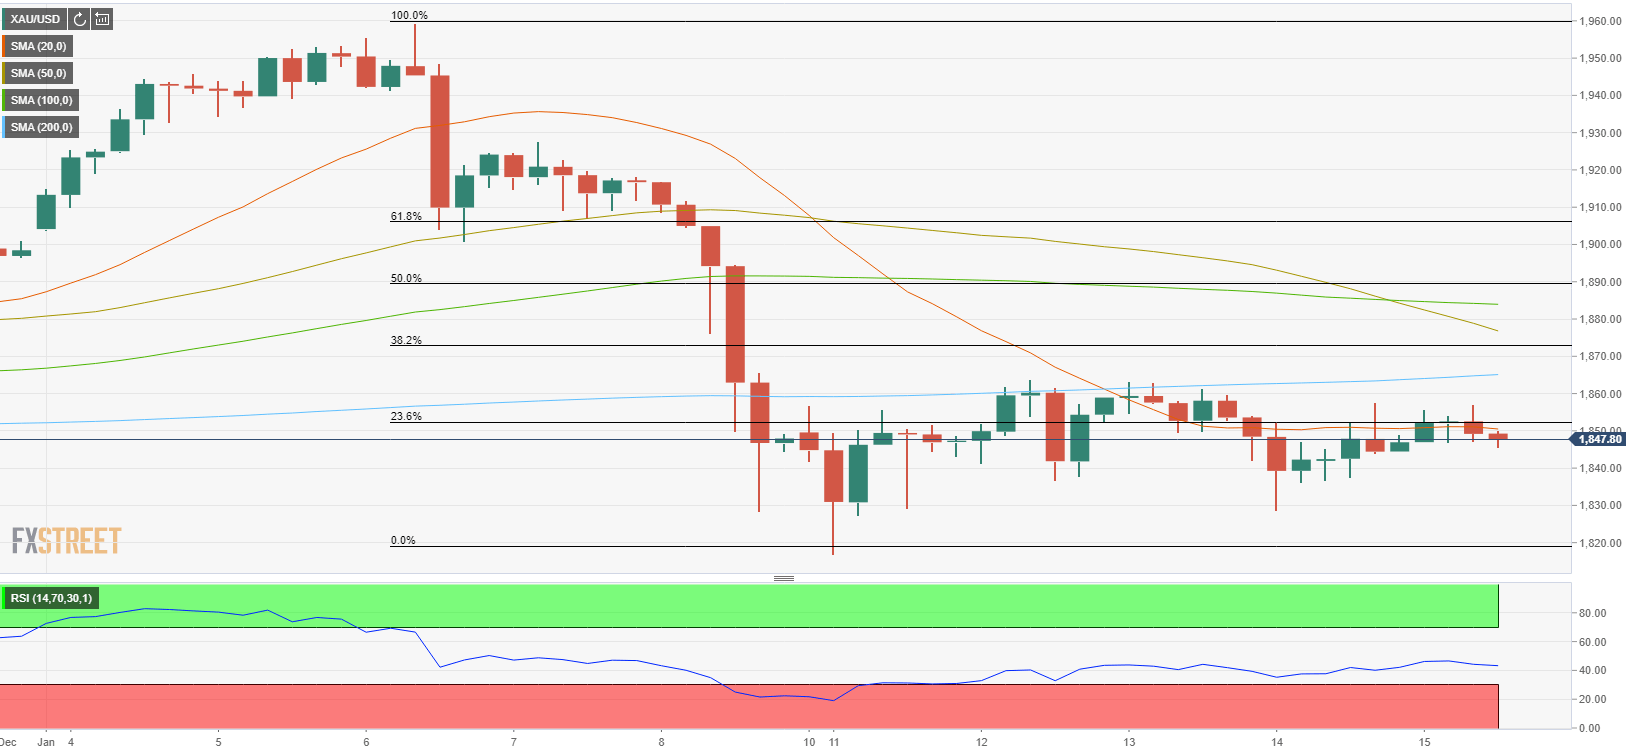
On the four-hour chart, the Relative Strength Index (RSI) indicator is moving sideways a little below 50, confirming the pair’s indecisiveness in the near term.
The initial resistance for gold aligns at $1,852, where the Fibonacci 23.6% retracement of the sharp decline seen from January 6 to 11 is located. Above that level, the 200-SMA is the next hurdle at $1,865. In the past seven trading days, XAU/USD failed to break above that level and if it manages to do so, it could target the next Fibo retracement level at $1,872.
On the other hand, key support seems to have formed at $1,817 (January 11 low). A daily close below that level could trigger a technical selloff and cause XAU/USD to extend its slide toward $1,800 (psychological level).
XAU/USD H4 chart