Gold has been extending its gains, marching forward as hopes for fiscal stimulus have returned. A bipartisan group of Senators unveiled a $908 billion program – that could be the beginning according to both Democrats and Republicans. The precious metal is benefiting from the speculation of more funds flowing to markets.
How is XAU/USD positioned on the charts? The path of least resistance remains to the upside.
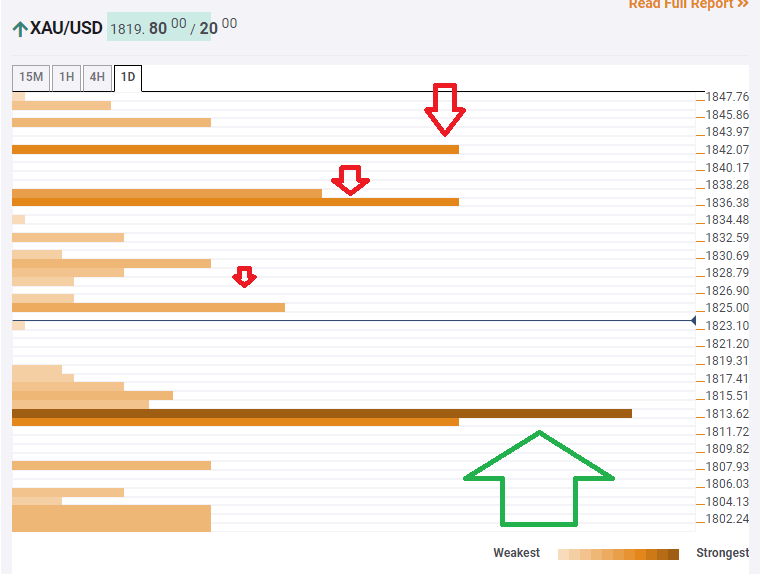
The Technical Confluences Indicator is showing that significant support awaits at $1,813, which is the convergence of the all-important Fibonacci 23.6% one-month and the Fibonacci 38.2% one-week.
Looking up, soft resistance is at $1,825, which is a juncture of lines including the Bollinger Band 15min-Middle, the Simple Moving Average 5-1h, and the SMA 10-one-day.
A more substantial cap awaits at $1,836, which is the confluence of the Bollinger Band 15min-Upper and the Fibonacci 61.8% one-week.
Further above, $1,842 is the upside target, where the Fibonacci 38.2% one-month and the Pivot Point one-day Resistance 2.
Key XAU/USD resistances and supports
Confluence Detector
The Confluence Detector finds exciting opportunities using Technical Confluences. The TC is a tool to locate and point out those price levels where there is a congestion of indicators, moving averages, Fibonacci levels, Pivot Points, etc. Knowing where these congestion points are located is very useful for the trader, and can be used as a basis for different strategies.
Learn more about Technical Confluence
