Gold (XAU/USD) tested the critical $1976 resistance while hovering near the highest levels in two weeks on Monday. The dovish Fed narrative, which implied that a period of low-interest rates would extend, continues to benefit the non-yielding gold.
Although a bounce in the US Treasury yields and risk-on market mood could make it an uphill task for the bulls to extend the advance towards the $2000 mark. Investors also remain wary ahead of the all-important US NFP report due later this week. In the meantime, let’s see how is gold positioned technically?
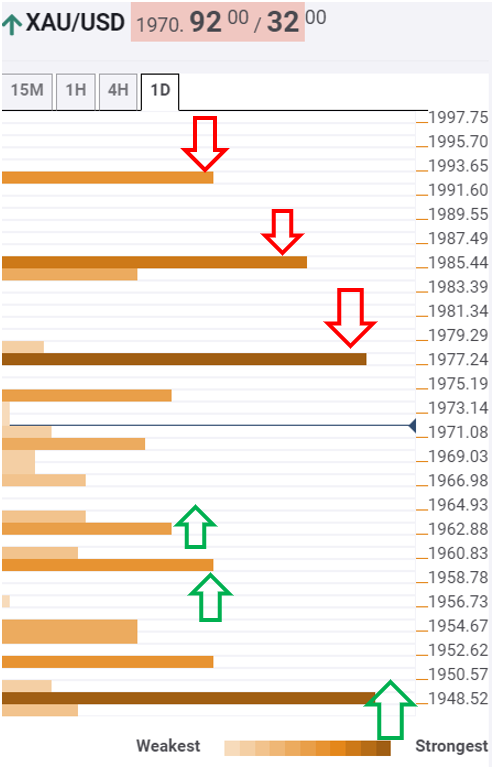
Gold: Key resistances and supports
The tool shows that gold tested the critical $1976 barrier, which is the convergence of the previous week high, previous high on four-hour and Bollinger Band four-hour Upper.
Acceptance above the latter will open doors towards the previous month’s high at $1985.
The next cap is seen at $1992, the pivot point one-week R1, as the bulls keep the $2000 level on their radars.
To the downside, minor support awaits at $1966, the convergence of the SMA5 four-hour and SMA50 15-minutes.
The immediate cushion is next seen at $1962, where the Fibonacci 23.6% one-day and Bollinger Band one-hour Middle intersect.
The Fibonacci 23.6% one-week support at $1959 could lend some support to the bulls. A sharp drop towards the robust support of $1950 (Fibonacci 38.2% one-week) should the above barrier fail to hold.
Here is how it looks on the tool
About the Confluence Detector
The TCI (Technical Confluences Indicator) is a tool to locate and point out those price levels where there is a congestion of indicators, moving averages, Fibonacci levels, Pivot Points, etc. Knowing where these congestion points are located is very useful for the trader, and can be used as a basis for different strategies.
Learn more about Technical Confluence
