Gold has tumbled down as investors are rushing to the US dollar – not as a safety trade – but rather as a response to upbeat US economic figures. Markit’s Purchasing Managers’ Indexes have beat estimates, showing the resilience of the world’s largest economy.
The precious metal lost ground as the figures lower the chances for new monetary and fiscal stimulus.
How is XAU/USD positioned on the technical charts?
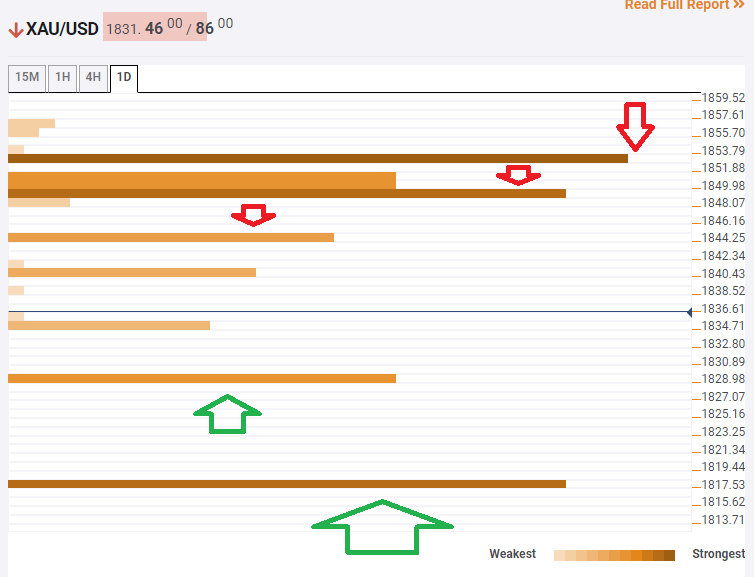
The Technical Confluences Indicator is showing that gold has some support at $1,828, which is where the Pivot Point one-week Support 2 hits the price.
Further down, a strong barrier is $1,817, where another pivot point awaits, the one-month Support 2.
Looking up, some resistance is at $1,844, which is the convergence of the Simple Moving Average 5-15m, the previous 1h-high, and the PP one-day Support 3.
It is followed by robust resistance at $1,848, which is a juncture including the Bollinger Band 4h-Lower, the Fibonacci 161.8% one-day, and the PP one-month Support 1.
An even stronger cap is at $1,852, where the previous weekly low and the PP one-day S2 meet up.
Key XAU/USD resistances and supports
Confluence Detector
The Confluence Detector finds exciting opportunities using Technical Confluences. The TC is a tool to locate and point out those price levels where there is a congestion of indicators, moving averages, Fibonacci levels, Pivot Points, etc. Knowing where these congestion points are located is very useful for the trader, and can be used as a basis for different strategies.
Learn more about Technical Confluence
