Gold has been finding its feet after the blow from the Federal Reserve. The world’s most powerful central bank did not provide additional stimulus, disappointing markets that expected more bond-buying. Without additional funds, the precious metal retreated from the highs.
While XAU/USD is lower, significant resistance is lower than it used to be. If a break occurs, gold may have more upside room to run.
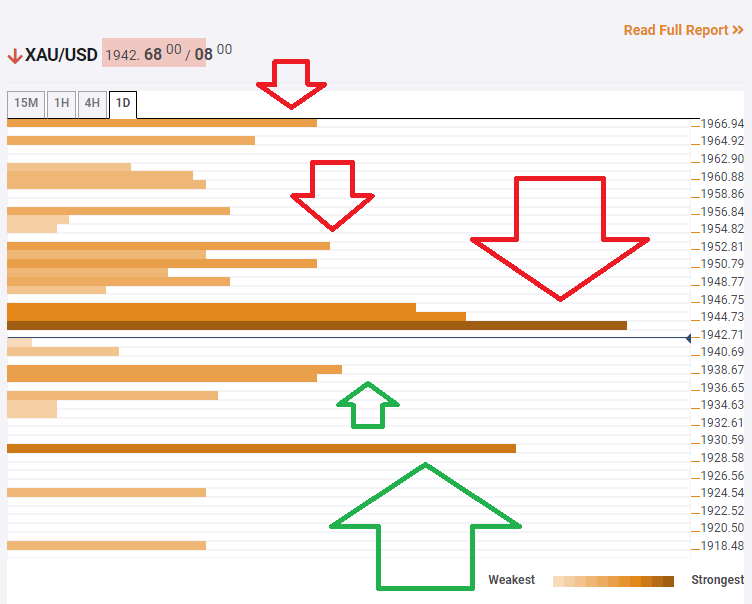
The Technical Confluences Indicator is showing that gold faces fierce resistance at around $1,943, which is the convergence of the Simple Moving Average 10-one-day, the SMA 50-15m, the Fibonacci 38.2% one-week, and the Fibonacci 38.2% one-month.
Further above, $1,952 is a soft line of resistance. It is where the SMA 100-15m and teh Fibonacci 23.6% one-week converge.
The high target is $1,966, which is the confluence of the previous weekly high, the BB 1h-Upper, and the Fibonacci 38.2% oen-day.
Support awaits at $1,938, which is the meeting point of the SMA 5-15m and the Piuvot Point one-day Support 2.
The next cushion is stronger. At $1,929, we see a juncture including 50-day SMA and the Fibonacci 61.8% oen-week.
Key XAU/USD resistances and supports
Confluence Detector
The Confluence Detector finds exciting opportunities using Technical Confluences. The TC is a tool to locate and point out those price levels where there is a congestion of indicators, moving averages, Fibonacci levels, Pivot Points, etc. Knowing where these congestion points are located is very useful for the trader, and can be used as a basis for different strategies.
Learn more about Technical Confluence
