- Gold built on its recovery from two-month lows and gained traction for the third straight day.
- Neutral technical indicators on the daily chart warrant caution for aggressive bullish traders.
Gold gained strong follow-through traction for the third consecutive session on Tuesday and climbed to one-week tops, around the $1848-49 region.
The emergence of some fresh selling around the US dollar was seen as a key factor that benefitted the dollar-denominated commodity. The greenback was further pressured by a pullback in the US Treasury bond yields, which drove some additional flows towards the non-yielding yellow metal.
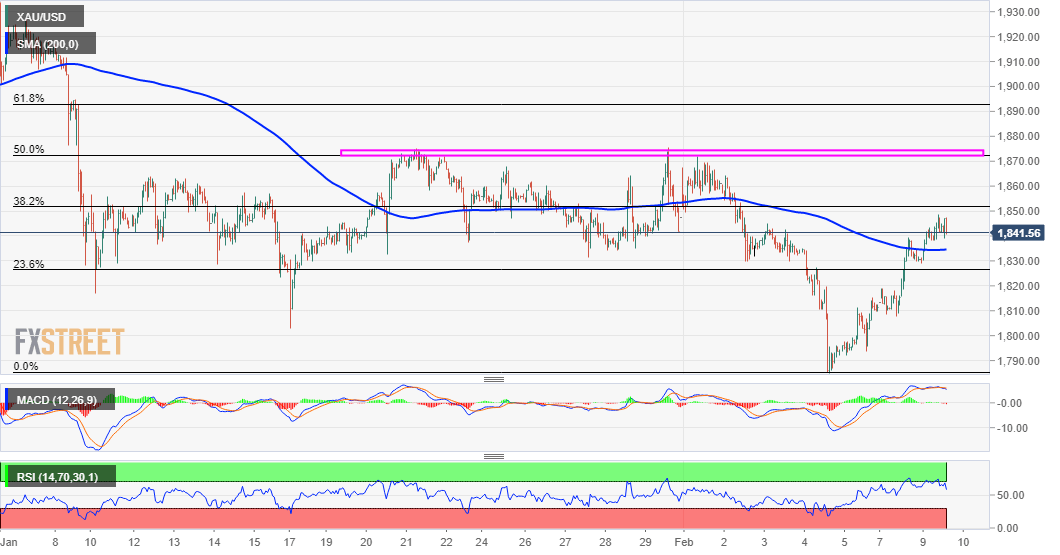
From a technical perspective, a sustained move back above 200-hour SMA was seen as a key trigger for bullish traders and driving the XAU/USD higher. That said, the positive momentum stalled just ahead of a resistance marked by the 38.2% Fibonacci level of the $1960-$1785 recent downfall.
The mentioned barrier is pegged near the $1853-54 region, which if cleared decisively will set the stage for a further near-term appreciating move. The XAU/USD might then accelerate the positive move and challenge the $1875-76 supply zone, which coincides with the 50% Fibo. level.
The later should act as a key pivotal point for short-term traders and help determine the commodity’s next leg of a directional move. A sustained move beyond should pave the way for additional gains and assist the XAU/USD to move back towards reclaiming the $1900 round-figure mark.
Meanwhile, technical indicators on the daily chart – though have been recovering from the positive territory – are yet to confirm a bullish bias. This, in turn, warrants some caution before positioning for any further appreciating move amid optimism over a strong economic recovery.
On the flip side, immediate support is pegged near the $1833-32 horizontal zone and is closely followed by the 23.6% Fibo. level, around the $1828 region. Failure to defend the mentioned support levels will negate any near-term positive bias and turn the XAU/USD vulnerable.
XAU/USD 1-hourly chart
Technical levels to watch
