- XAU/USD ends the trading week nearing the 2020 high.
- The level to beat for bulls is the 1690/1700 resistance zone.
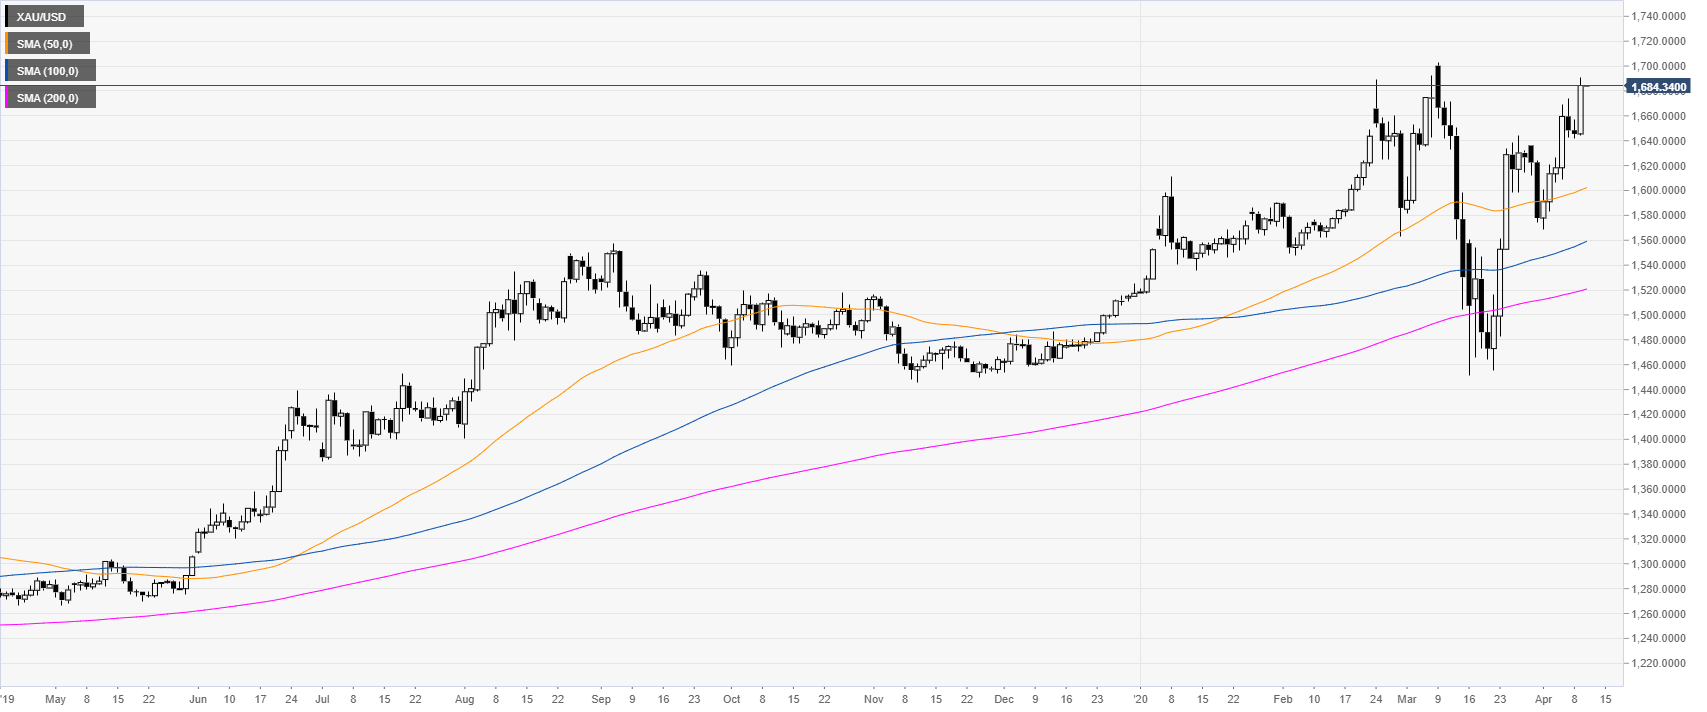
XAU/USD daily chart
Gold is nearing the 2020 highs while above the main DMA (daily simple moving average) suggesting that bulls remain in full control of the market.
XAU/USD four-hour chart
Gold is trading above its main SMAs while challenging the 1690/1700 resistance zone as bulls would need a break above the above-mentioned level to extend the up move which would introduce scope to the 1740 resistance on the way up. On the flip side, support can be seen near the 1660, 1640 and 1620 levels.
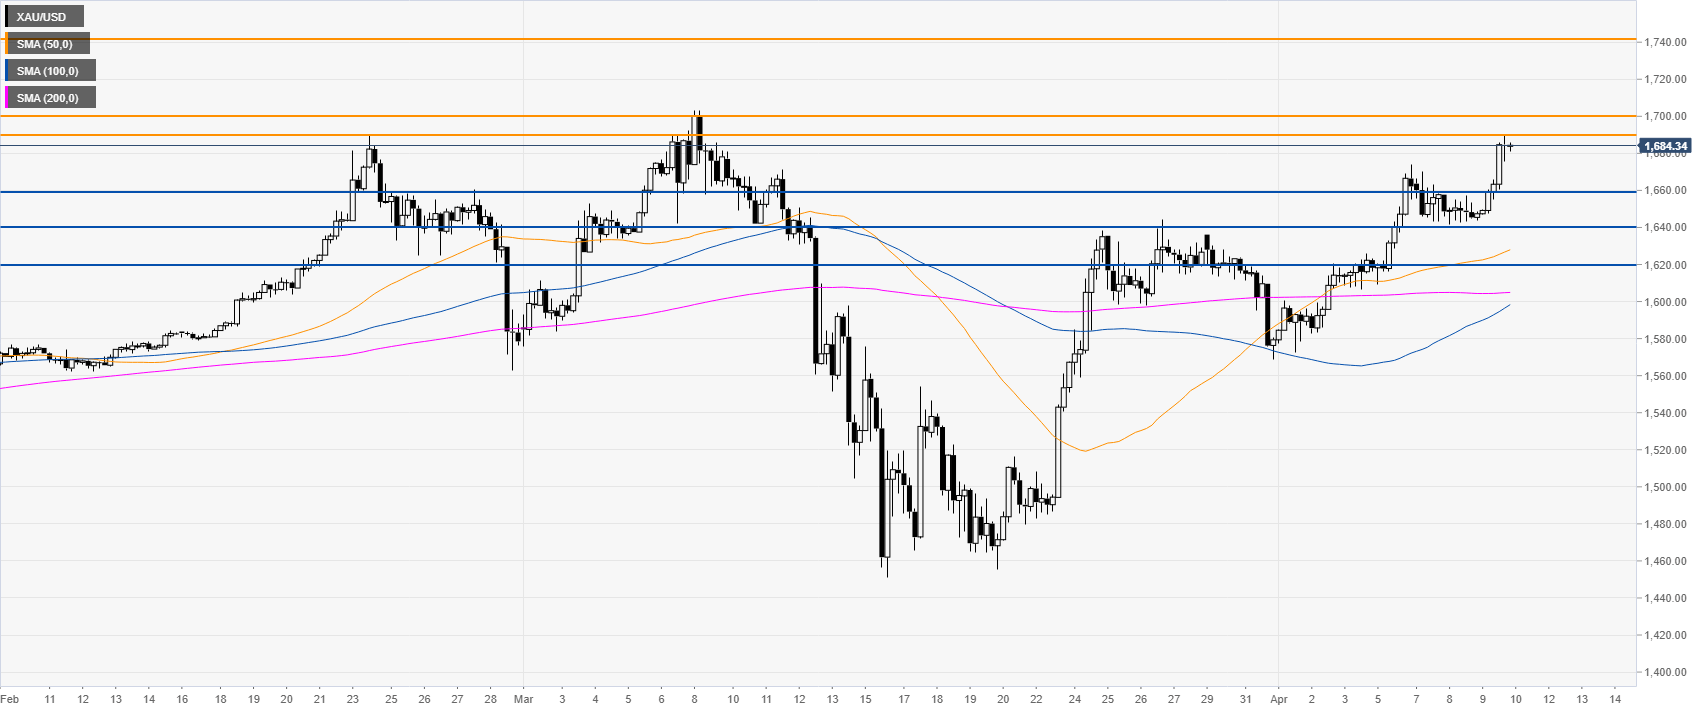
Additional key levels
