- Rising Treasury yields outweigh the DXY’s sell-off, weighing on Gold.
- XAU/USD remains poised to test the 100-HMA support.
- Recapturing the 50-HMA Is critical to negating the downside bias.
Gold (XAU/USD) is building onto Tuesday’s rally, benefiting from broad risk-aversion, fuelled by growing coronavirus concerns.
The strength in the US Treasury yields fails to temper the sentiment around the gold buyers, as the technical setup also remains in favor of the optimists.
Gold Price Chart: Hourly
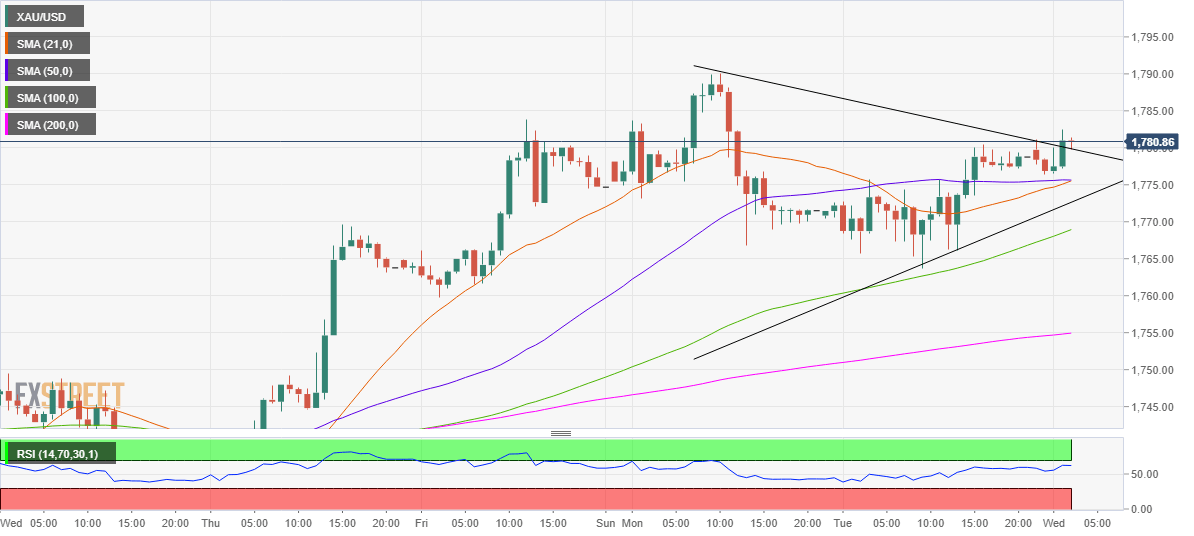
On the one-hour chart, gold is approaching last week’s high at $1784 after confirming a symmetrical triangle break in the last hour.
Impending bull cross on the said time frame also points to a potential move higher. The bullish crossover would get validated once the 21-hourly moving average (HMA) pierces the 50-HMA from below.
The Relative Strength Index (RSI) has turned slightly lower but remains comfortably above the midline, keeping the upside bias intact.
A break above the previous week high could expose the seven-week tops at $1790, above which a test of the $1800 level would be inevitable.
To the downside, an immediate cushion is seen at $1775, the intersection of the 21 and 50-HMAs.
The next significant cap awaits at the triangle support of $1772. Acceptance below the latter would invalidate the bullish breakout, calling for a test of the 100-HMA support at $1769.
Gold: Additional levels
