Gold is down but certainly not out – trading under $1,900 in choppy trading amid the messy US elections. President Donald Trump and rival Joe Biden are still waiting for the final tallies in seven states. The nail-biting campaign has triggered high volatility and worries about a contested election is somewhat weighing on the precious metal.
How is XAU/USD positioned on the charts?
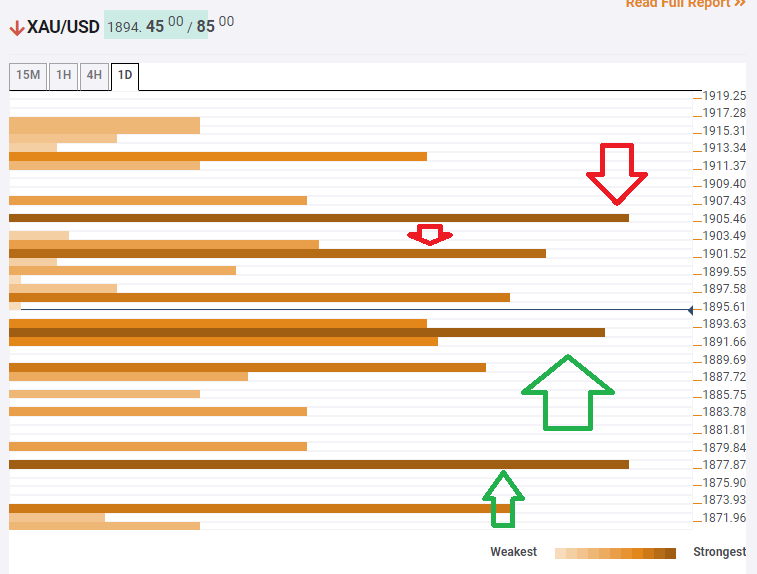
The Technical Confluences Indicator is showing that gold has support at $1,892, which is the convergence of the Fibonacci 61.8% one-week, the Pivot Point one-day, and the Simple Moving Average 50-4h.
Further down, another cushion awaits at $1,877, which is the meeting point of the Fibonacci 23.6% one-month and the Pivot Point one-day Support 2.
Looking up, resistance is at $1,901, which is a juncture including the SMA 10-4h, the Bollinger Band one-day Middle, and the SMA 5-1h.
The next cap is at $1,896, which is the confluence of the Fibonacci 23.% one-day and the Fibonacci 61.8% one-month.
Key XAU/USD resistances and supports
Confluence Detector
The Confluence Detector finds exciting opportunities using Technical Confluences. The TC is a tool to locate and point out those price levels where there is a congestion of indicators, moving averages, Fibonacci levels, Pivot Points, etc. Knowing where these congestion points are located is very useful for the trader, and can be used as a basis for different strategies.
Learn more about Technical Confluence
