Gold regains $1,900, currently around $1,908, following its almost $10.00 run-up during the pre-European session on Friday. The yellow metal recently surged after US President Donald Trump tested positive for the coronavirus (COVID-19).
Following the test results, the White House physician Sean Conley said, as per the CNBC, the President “to continue carrying out his duties without disruption while recovering”. However, the risks slump after the announcement at the time when the US stimulus deadlock needed a strong push.
Read: Breaking: US President Trump tests positive, S&P 500 Futures slumps over 30 points
Key levels to watch
With the clear break of $1,904 resistance, comprising the previous high on the four-hour chart and 38.2% Fibonacci retracement on 1M, gold bulls can easily overcome the $1,910 immediate resistance that includes the previous high on the 15-minutes chart.
As a result, a small upside barrier around $1,915, including SMA 100 on the four-hour play, can quickly appear on the buyers’ radar before September 22 high near $1,920.
Alternatively, a downside break below $1,904 will have to get validation from the sellers by breaking the $1,900 round-figures.
In doing so, the $1,880-78 support area comprising the late-September high will gain the market attention.
Here is how it looks on the tool
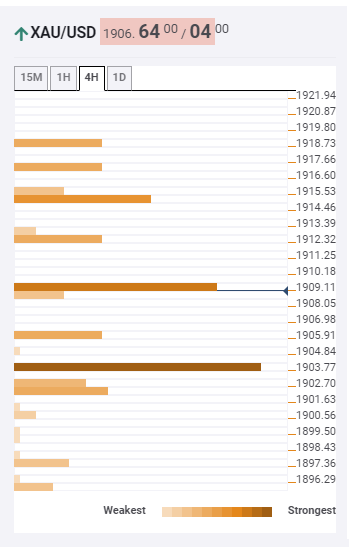
About the Confluence Detector
The TCI (Technical Confluences Indicator) is a tool to locate and point out those price levels where there is a congestion of indicators, moving averages, Fibonacci levels, Pivot Points, etc. Knowing where these congestion points are located is very useful for the trader, and can be used as a basis for different strategies.
Learn more about Technical Confluence
