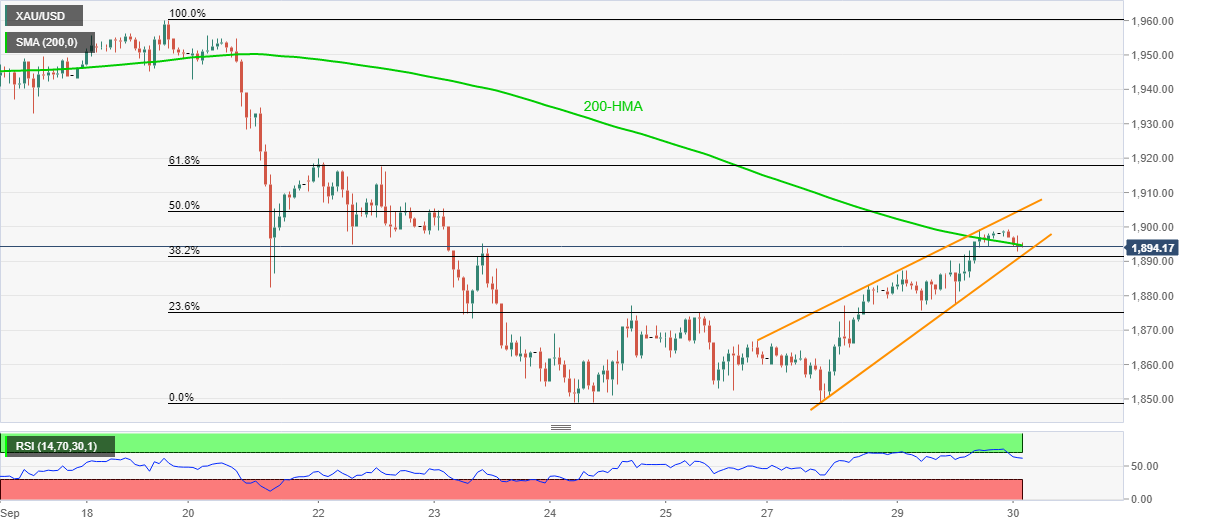
- Gold snaps two-day winning streak following its pullback from $1,899.38.
- 200-HMA offers immediate support ahead of the bearish pattern’s lower line.
- Bulls need a clear break beyond September 22 for confirmation.
Gold prices bounce off an intraday low of $1,892.72 to $1,896.70 amid Wednesday’s Asian session. The yellow metal recently dropped after the US presidential debate questioned market sentiment. Technically, a three-day-old rising wedge formation on the hourly chart keeps sellers hopeful even as 200-HMA probes immediate downside.
Follow: Four more years or time for change? – Live coverage
Hence, bears are waiting for a clear break of the $1,891.80 support line to confirm the bearish chart play, which in turn can drag the quote towards the monthly low near $1,850/49.
In doing so, September 24 top close to $1,877 can offer an intermediate halt while the early July top near $1,818 can lure gold traders below $1,849.
Alternatively, a clear bounce off the 200-HMA level of $1,894.60 can again attack $1,900 whereas a confluence of 50% Fibonacci retracement of September 18-24 declines and the upper line of the wedge, near $1,905, can question the gold buyers afterward.
Even if the yellow metal rises past-$1,905, the bulls are less likely to be convinced as 61.8% Fibonacci retracement and September 22 peak can probe further upside around $1,918/20.
Gold hourly chart
Trend: Pullback expected

