- Gold is in the hands of the bulls but a correction is on the cards.
- The monthly outlook is critical which makes the next few weeks testing for the gold market.
Update: Gold extended its sideways consolidative price action through the first half of the European session and remained confined in a range below the $1,840 level. A modest uptick in the US Treasury bond yields extended some support to the US dollar. This, in turn, was seen as a key factor that capped the upside for the dollar-denominated commodity.
The negative factor, to a larger extent, was offset by a generally weaker risk sentiment, which tends to benefit traditional safe-haven assets, including gold. The global risk sentiment took a hit amid speculations that rising inflation might force the Fed to tighten its monetary policy sooner rather than later. Hence, the key focus will remain on Wednesday’s release of the US consumer inflation figures, which will play a key role in influencing the next leg of a directional move for the non-yielding yellow metal.
Update: Gold (XAU/USD) edge higher around $1,837, up 0.10% intraday, ahead of Tuesday’s European session. In doing so, the gold prices print a four-day winning streak as the US dollar fails to extend the previous day’s recovery moves.
Although the reflation fears jump back to the table, exerting downside pressure on the stock futures, the US Treasury yields remain mostly inactive, despite pausing a two-day uptrend. Also, the Fed policymakers have been flashing mixed signals over the future course of action and hence unearth the doubts over easy money policies after Friday’s US jobs report back the doves.
As a result, the greenback gauge defies the bounce off 10-week low amid cautious sentiment ahead of Wednesday’s US Consumer Price Index (CPI) for April, which in turn keeps a tab on gold buyers.
Update: Gold is consolidating gains sub $1,840 level in the Asian session. The price of gold possessed a rangebound movement between $1,830 and $1,838. At the time of writing, XAU/USD is trading at $1835.75, down 0.11% on the day.

XAU/USD hourly chart
On the hourly chart, the downward sloping line from the previous day’s high of $1,845.46, acts as a wall of defense for gold bulls, keeping prices a tad below the $1,840 mark. A break and sustained move beyond the descending trendline is mandatory to continue with the upward momentum. The momentum oscillator, the Relative Strength Index (RSI) remains optimistic above 50.
The price of gold is firmly in the bull’s hands and that can be seen not only in the spot market but in the most recent CFTC positioning data and futures markets.
Of late, money managers increased gold length in covering relatively large amounts of their short exposure.
From a fundamental standpoint, the rate environment became more favourable.
The recent Nonfarm Payrolls data, counterintuitively, has sent markets into a buying frenzy for riskier asset classes which have hammered down the nail for the US dollar and have underpinned the price of the yellow metal.
”While statements from the US central bank pointed to unwavering support for a full employment policy, even if inflation trends move convincingly above target, some specs (likely trend-following funds) still reduced longs by a small amount,” analysts at TD Securities explained.
”A disappointing jobs report, which featured higher than expected wage increases and unemployment rates, suggests that gold is well-positioned to challenge technical resistance near $1,850/oz,” the analysts added, which brings us to the following charts.
Gold price technical analysis
Monthly chart
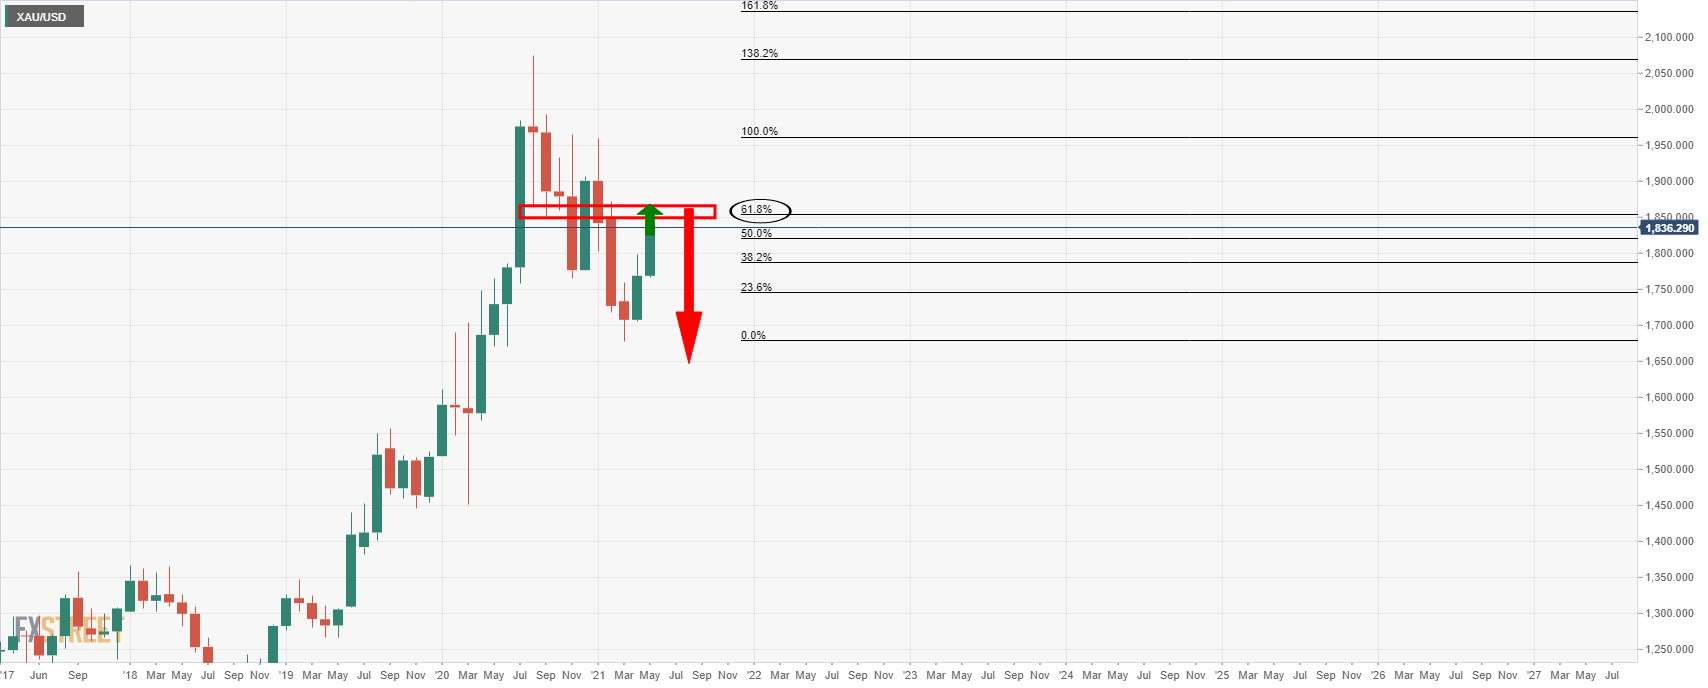
The monthly conditions are ripe for a good test of the psychological 1,850 level and the 61.8% Fibonacci retracement of the prior bearish impulse.
Should the market be firm there with plenty of offers, then the liquidity could expel the bulls and could be the basis to see an onwards downside continuation over the coming months.
With that being said, and in line with the current fundamentals which are supporting the prospects of a full-on supercycle in commodity prices and relation, then a break of the foreseen resistance would be another string to the bow for a bullish continuation.
Indeed, the next weeks will be an important one for the gold market and bulls will need to see a bullish month-end close.
Weekly chart
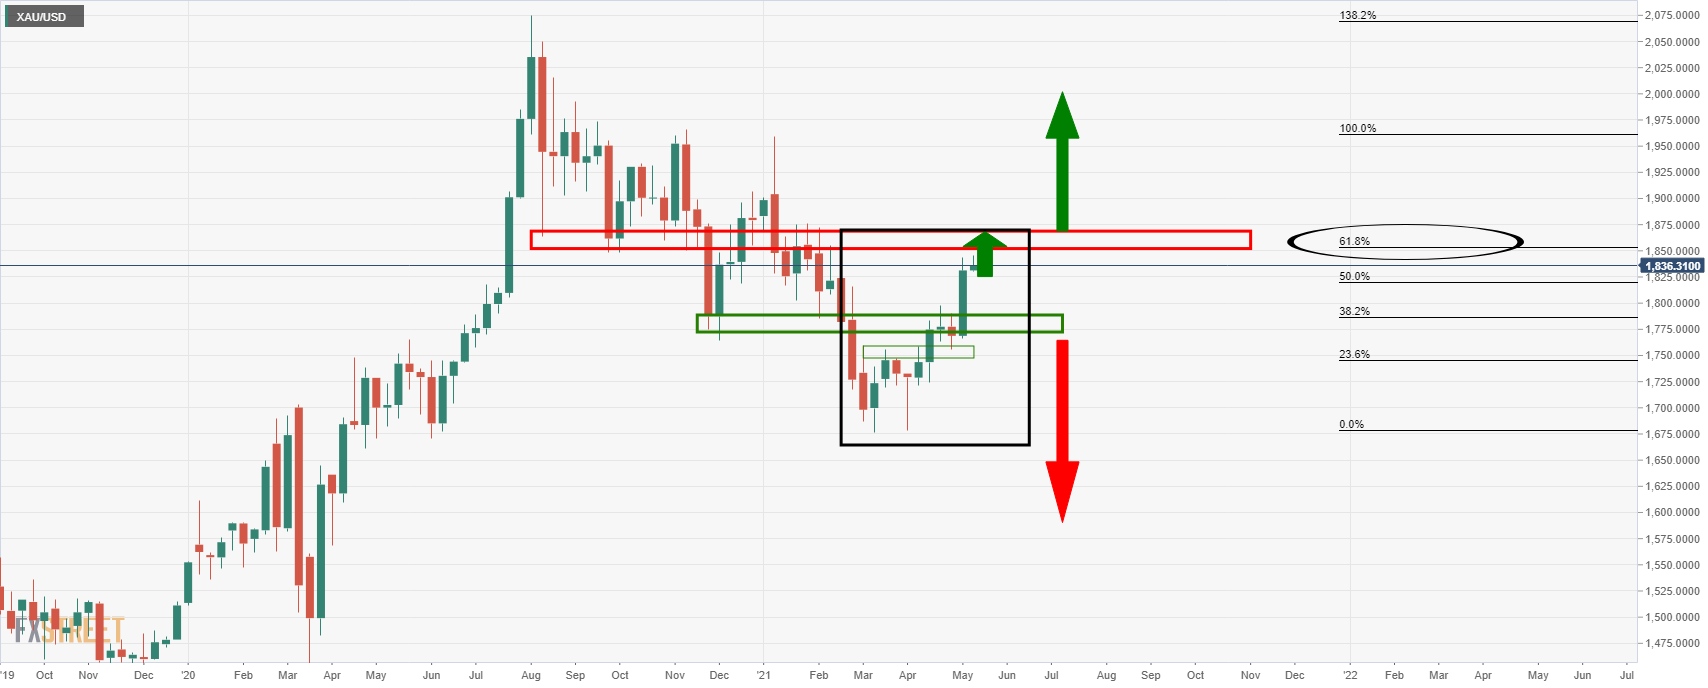
As for the weekly chart, the W-formation was completed in a textbook fashion.
The price made a perfect retest of the W-formation’s neckline prior to extending higher in a new bullish impulse.
However, the impulse has been very strong and has surpassed a -61.8% Fibonacci retracement of the prior correction.
Nevertheless, markets like to push the barriers and following perhaps a healthy daily correction, then the 1,850’s may even give way to a deeper test of the expected supply zone.
A break of the supply zone should leave the bulls in good stead for the forthcoming weeks.
Daily chart
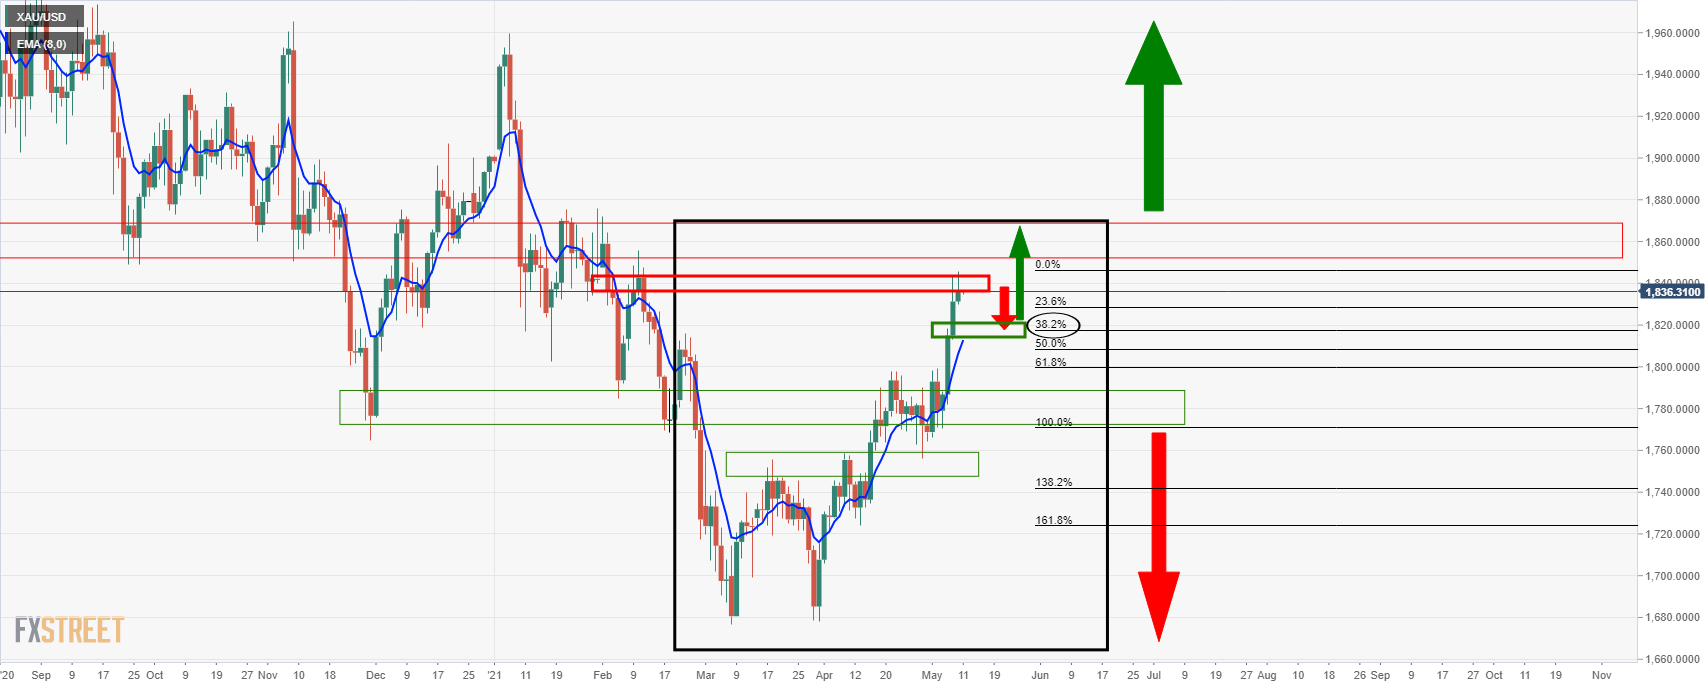
As pointed out, the current bullish leg is somewhat overextended and the daily chart illustrates just that.
A correction to at least a 38.2% Fibo that meets structure on the lower time frames, such as the 4-hour chart, would have a confluence with the 8 EMA.
If bulls step in there, then it could be the making for an onwards daily bullish market to test deeper into the monthly supply zone, with 1,850 the first port of call.
