- Gold extended its directionless price moves for the second straight session on Tuesday.
- The formation of a symmetrical triangle points to an extension of the prior bearish trend.
Gold seesawed between tepid gains/minor losses for the second consecutive day and remained confined in a range, around the $1850-60 region through the mid-European session on Tuesday.
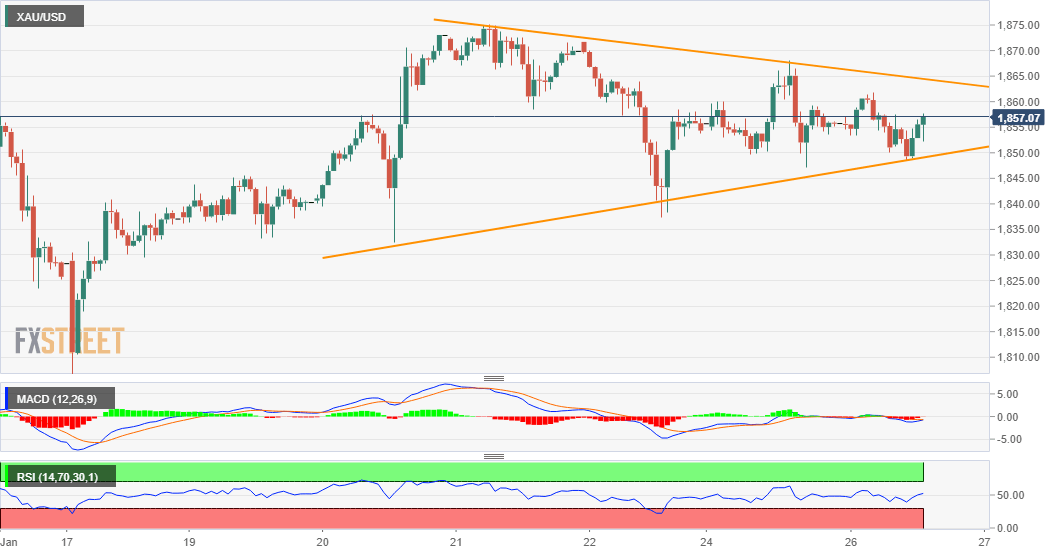
Meanwhile, the precious metal has been oscillating between two converging trend-lines over the past one-week or so. The range-bound price action now seemed to constitute the formation of a symmetrical triangle, which often marks a continuation of the prior trend.
Given the sharp pullback from monthly tops, around the $1960 region touched on January 6, the near-term bias remains tilted in favour of bearish traders. That said, the direction of the next major move can only be determined after the occurrence of a valid breakout.
Neutral technical indicators on daily/4-hourly charts also warrant some caution for aggressive traders and before positioning for any firm near-term direction. Investors might also prefer to stay on the sidelines ahead of the FOMC policy decision on Wednesday.
Hence, any dip towards the triangle support, currently near the $1842 region, is more likely to attract some buying. Some follow-through selling will mark a bearish breakdown and drag the XAU/USD back towards last week’s swing lows, around the $1800 mark.
On the flip side, the top boundary of the mentioned triangle, around the $1865 area, might act as immediate strong resistance. This is followed by the $1872 supply zone, above which a bout of short-covering could push the XAU/USD closer to the $1900 round-figure.
XAU/USD 1-hourly chart
Technical levels to watch
