- Gold could be on the verge of a lower low, but the hourly time frame is key.
- The hourly support structure is guarding a break to test bullish commitments at 1,800.
- The 10-day EMA and confluence of the 50% mean reversion are also offering support.
Gold is trading around 0.57% higher on the day as the price firms from a technical confluence area of support on both the daily and hourly time frames.
XAU/USD has travelled from a low of $1,808.86 to a high of $1,828.83 so far on the day.
The greenback remains firm around the highs for the week due to a double whammy of inflation data that is giving the market some fresh concerns.
Firstly, the Consumer Price Index from the prior day lifted US yields when US consumer prices increased by the most in nearly 12 years in April.
Then, on Thursday, the US Labor Department reported higher producer prices in April, further evidence that inflation is rising in the United States.
The Producer Price Index rose 0.6% in April after surging 1.0% in March. In the 12 months through April, the PPI shot up 6.2%. That was the biggest year-on-year rise since the series was revamped in 2010 and followed a 4.2% jump in March.
Markets are now betting that the Federal Reserve could raise interest rates sooner than the bank has forecast.
However, the US Federal Reserve Vice Chair Richard Clarida said that weak job growth and strong inflation in April will not have altered any monetary policy plans at the Fed.
”Yesterday’s inflation print fed into the market’s fear of runaway prices, with a chorus of investors expecting the Fed’s uber-dovish stance, combined with a massive global fiscal thrust, to translate into a policy mistake sparking a sharp overshoot,” analysts at TD Securities have explained.
”In this sense, it is worth highlighting that gold is underperforming against periods of high inflation. CTA short covering has helped prices nudge higher but the yellow metal will struggle to follow-through without further support from real rates.”
Finally, the analysts warned that they ”estimate algorithmic trend followers could potentially be whipsawed should prices close below $1775/oz, particularly as the Indian lockdown saps appetite for physical metal.”
Gold technical analysis
Meanwhile, from a technical stance, the gold price has moved in on the 10-day EMA within the solid uptrend and could still attract buyers in what would be a correction of the prior weekly and daily bullish impulse.
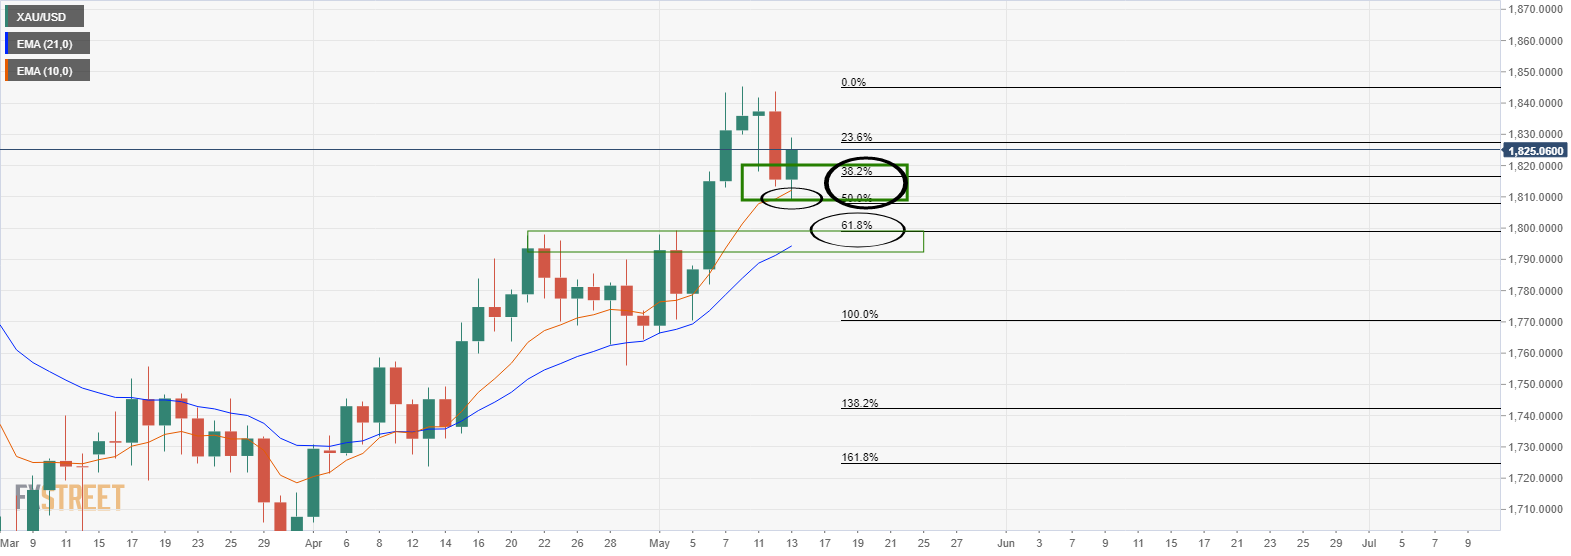
We have already seen the 50% mean reversion at 1,808, today’s lows.
A deeper move and a break below the 10-day EMA opens a risk of a test of the next confluence zone in the 61.8% Fibonacci retracement that comes in at 1,800 and aligns with the 22nd April highs as the support structure.
On the hourly chart, this will involve a break of two critical supports and will drag the bulls and bears into a barroom brawl scenario.
Bears will want to avoid such a trap and hope for a discount if the price breaks below 1,815, fading the correction of the break:

As can be seen, there is a void of liquidity below the second support structure which bears will wish to exploit on a break of the structure.
Lower time frames, such as the 15 or 5-min charts, offer a vantage point in such scenarios where the price action can be fast, looking for smaller price change increments and bearish structure for an optimal entry point.
