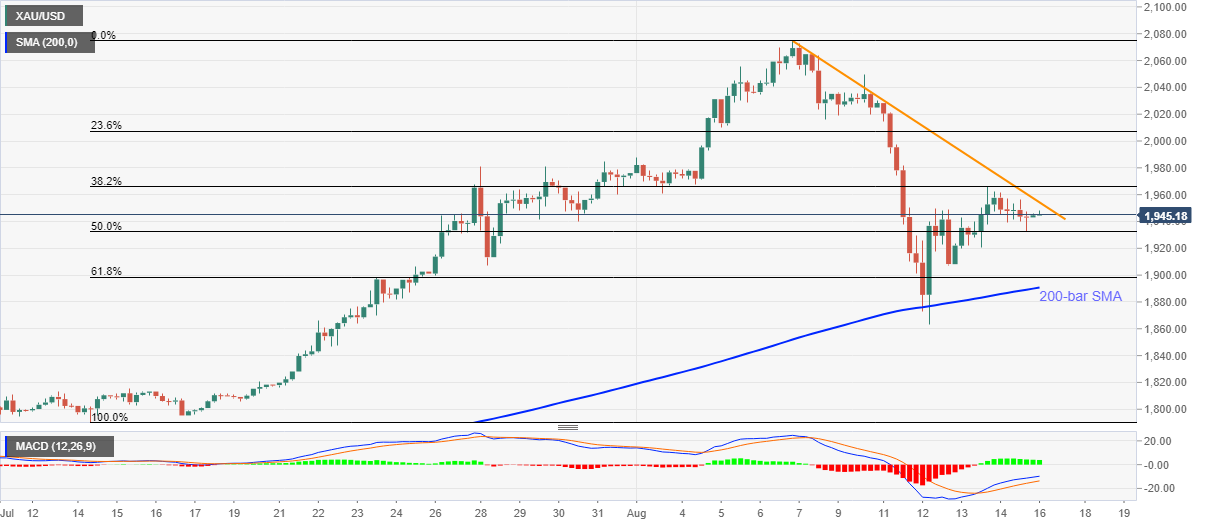
- Gold keeps late Friday’s pullback from $1,932.46.
- The bullion stays pressured between a falling trend line from August 06 and 200-bar SMA.
- Bullish MACD, strong downside supports favor the bulls.
Gold prices seesaw near $1,945 during the early-Monday in Asia. Despite carrying the Friday’s bounce off $1,932.46, the yellow metal stays inside a short-term trading range between a seven-day-old falling trend line and 200-bar SMA.
While the bullion’s sluggish performance during Thursday and Friday keeps the bears’ hopeful towards breaking the key SMA, important Fibonacci retracement levels of July 14 to August 06 upside joins the key ascending trend line from March to restrict downside.
As a result, bullish MACD may gain major attention while joining the fundamentals that increase the rush to risk-safety to suggest an upside break of the said resistance line, at $1,955 now.
In doing so, $1,988 and $2,000 can please the short-term buyers before pushing them to confront multiple upside barriers near $2,015 and $2,040. Though, the metal’s further rise will be capped below $2,100.
Alternatively, 50% and 61.8% Fibonacci retracement levels, respectively around $1,932 and $1,898, may offer immediate supports during the bullion’s fall ahead of highlighting 200-bar SMA level of $1,890.
It should, however, be noted that the bears will have to stay cautious unless the gold prices slip below an upward sloping trend line from March, currently around $,1875.
Gold four-hour chart
Trend: Bullish
