- XAU/USD remains on track to close second straight day in the red.
- Gold continues to trade below critical 200-day SMA.
- RSI indicator on daily chart edges lower toward 40.
The XAU/USD pair came under strong bearish pressure in the second half of the day and fell to its lowest level in more than a week at $1,831. Although gold staged a rebound following that drop, it lost its momentum near $1,850 and was last seen losing 0.32% on the day at $1,845.
Gold technical outlook
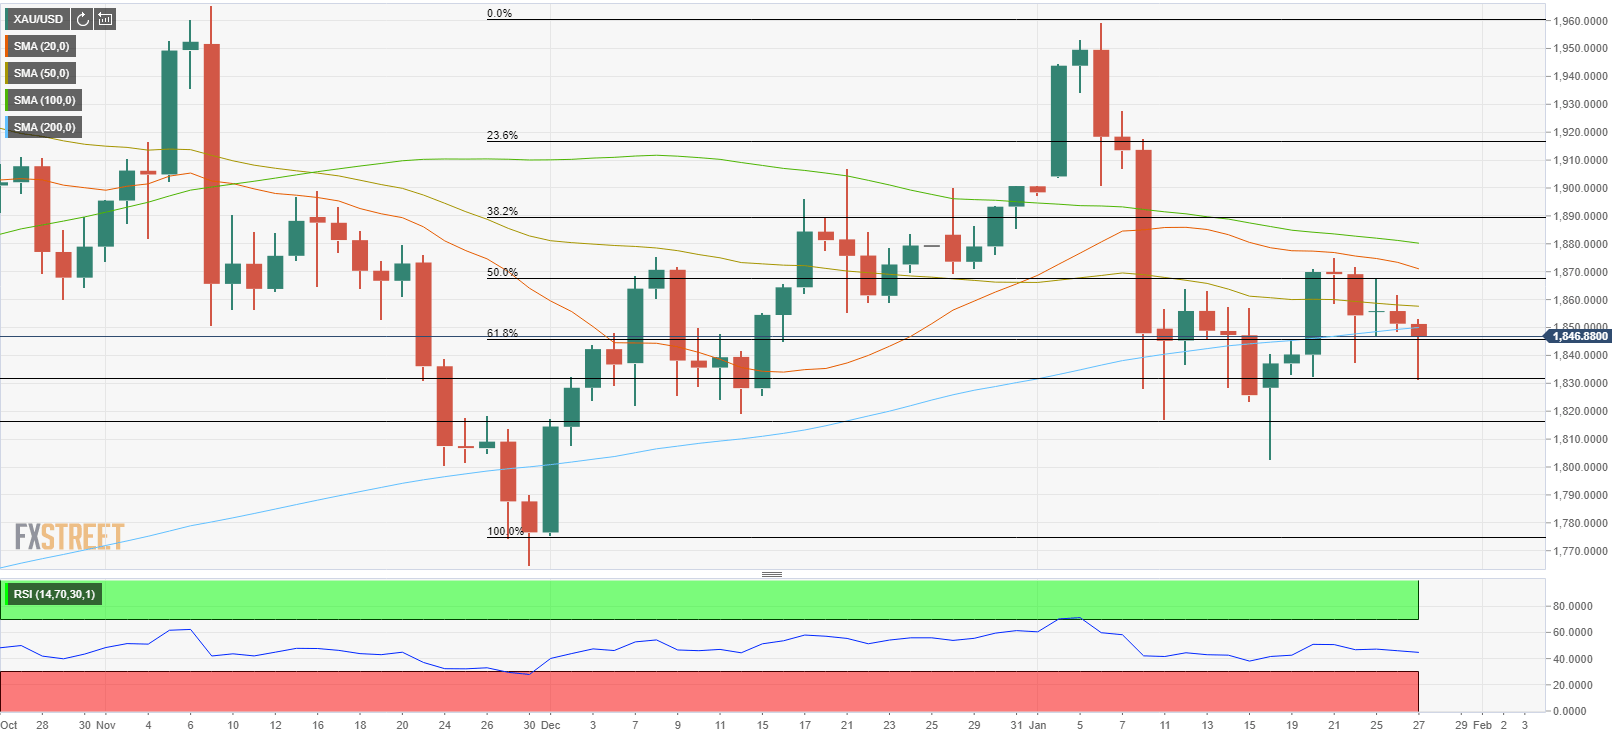
With Wednesday’s sharp decline, XAU/USD remains on track to close below the critical 200-day SMA, which could discourage buyers from making large bets for the time being. Additionally, the Relative Strength Index indicator on the daily chart continues to edge lower toward 40, suggesting that the recent recovery was a technical correction rather than a decisive shift in direction.
On the downside, $1,830 (daily low) aligns as the first technical support ahead of $1,817 (Jan. 11 low). On the other hand, the 200-day SMA forms the first hurdle at $1,850, which is reinforced by the Fibonacci 61.8% retracement of the December rally, before $1,857 (50-day SMA). Unless the pair manages to make a convincing break above $1,850, sellers are likely to dominate gold’s price action.