Gold has been showing signs of strength, initially resisting the increase in bond yields and holding above $1,700. As returns on US debt subsided – following weak US inflation figures – XAU/USD moved higher and may now extend its gains.
How is the precious metal positioned on the charts?
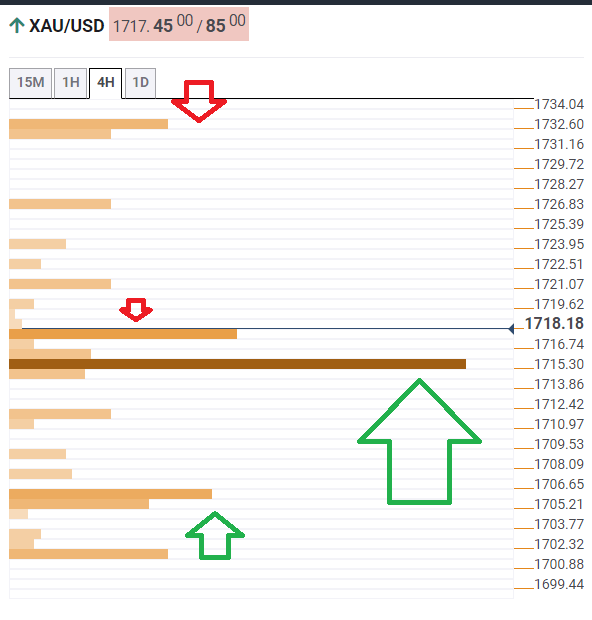
The Technical Confluences Detector is showing that gold has topped the critical level of $1,715, which now turns into support. A dense cluster of technical levels awaits there, including the Simple Moving Average 5-4h, the SMA 10-1h, the Bollinger Band 1h-Middle, the SMA 5-1h, the SMA 100-15m, and the all-important Fibonacci 38.2% one-week.
If the upward swing is confirmed, the next near-term target is $1,718, which is where the previous month’s low meets the SMA 10-15m.
The upside target for XAU/USD is $1,732, which is where the Pivot Point one-day Resistance 1 and the Fibonacci 61.8% one-week converge.
Below $1,715, the next cushion is at $1,706, which is the confluence of the Fibonacci 23.6% one-week and the Fibonacci 38.2% one-day.
XAU/USD resistance and support levels
Confluence Detector
The Confluence Detector finds exciting opportunities using Technical Confluences. The TC is a tool to locate and point out those price levels where there is a congestion of indicators, moving averages, Fibonacci levels, Pivot Points, etc. Knowing where these congestion points are located is very useful for the trader, and can be used as a basis for different strategies.
Learn more about Technical Confluence
