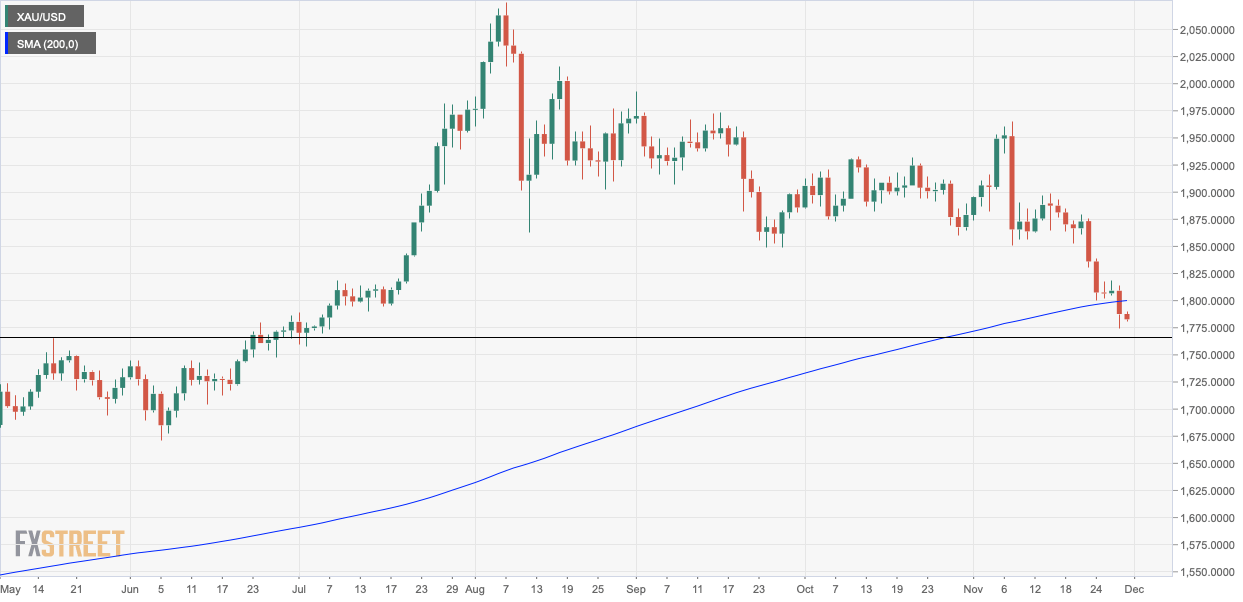
- Gold has flipped the 200-day SMA support into resistance.
- The breakdown has opened the doors to support at $1,765.
Gold is trading below the widely-followed 200-day Simple Moving Average (SMA) for the first time since March.
The long-term technical line is currently located at $1,800 and the metal is changing hands near $1,783 per ounce, representing a 0.25% loss on the day.
The yellow metal closed below the 200-day SMA on Friday, exposing deeper support at $1,765 (May 18 low). The breakdown has been reinforced by the bull failure at the former support-turned-hurdle of the 200-day SMA seen early today.
While the 14-day relative strength index has dropped below 30 to indicate oversold condition, the indicator would gain credence if and when signs of seller exhaustion emerge on the price chart.
The immediate bearish view would be invalidated if the metal finds acceptance above the 200-day SMA at $1,800.
Daily chart
Trend: Bearish
Technical levels

