- Gold sellers look to establish a foothold below the 200-day SMA.
- That may invite stronger selling pressure, leading to a deeper decline toward November lows.
Gold is currently trading below the 200-day Simple Moving Average (SMA) at $1,848, having closed below the long-term technical line on Wednesday.
It remains to be seen if the latest break below the widely-tracked average is sustained. The SMA was breached in late November and couple of times earlier this month. However, sellers failed to establish a foothold under the average support then.
Should sellers succeed this time, more bears may join the market, yielding a deeper decline. Major support is seen at $1,764 (November low).
A close above the lower high of $1,875 created on Jan. 21 would confirm a reversal higher and expose resistance at $1,959 (Jan. 6 high).
Daily chart
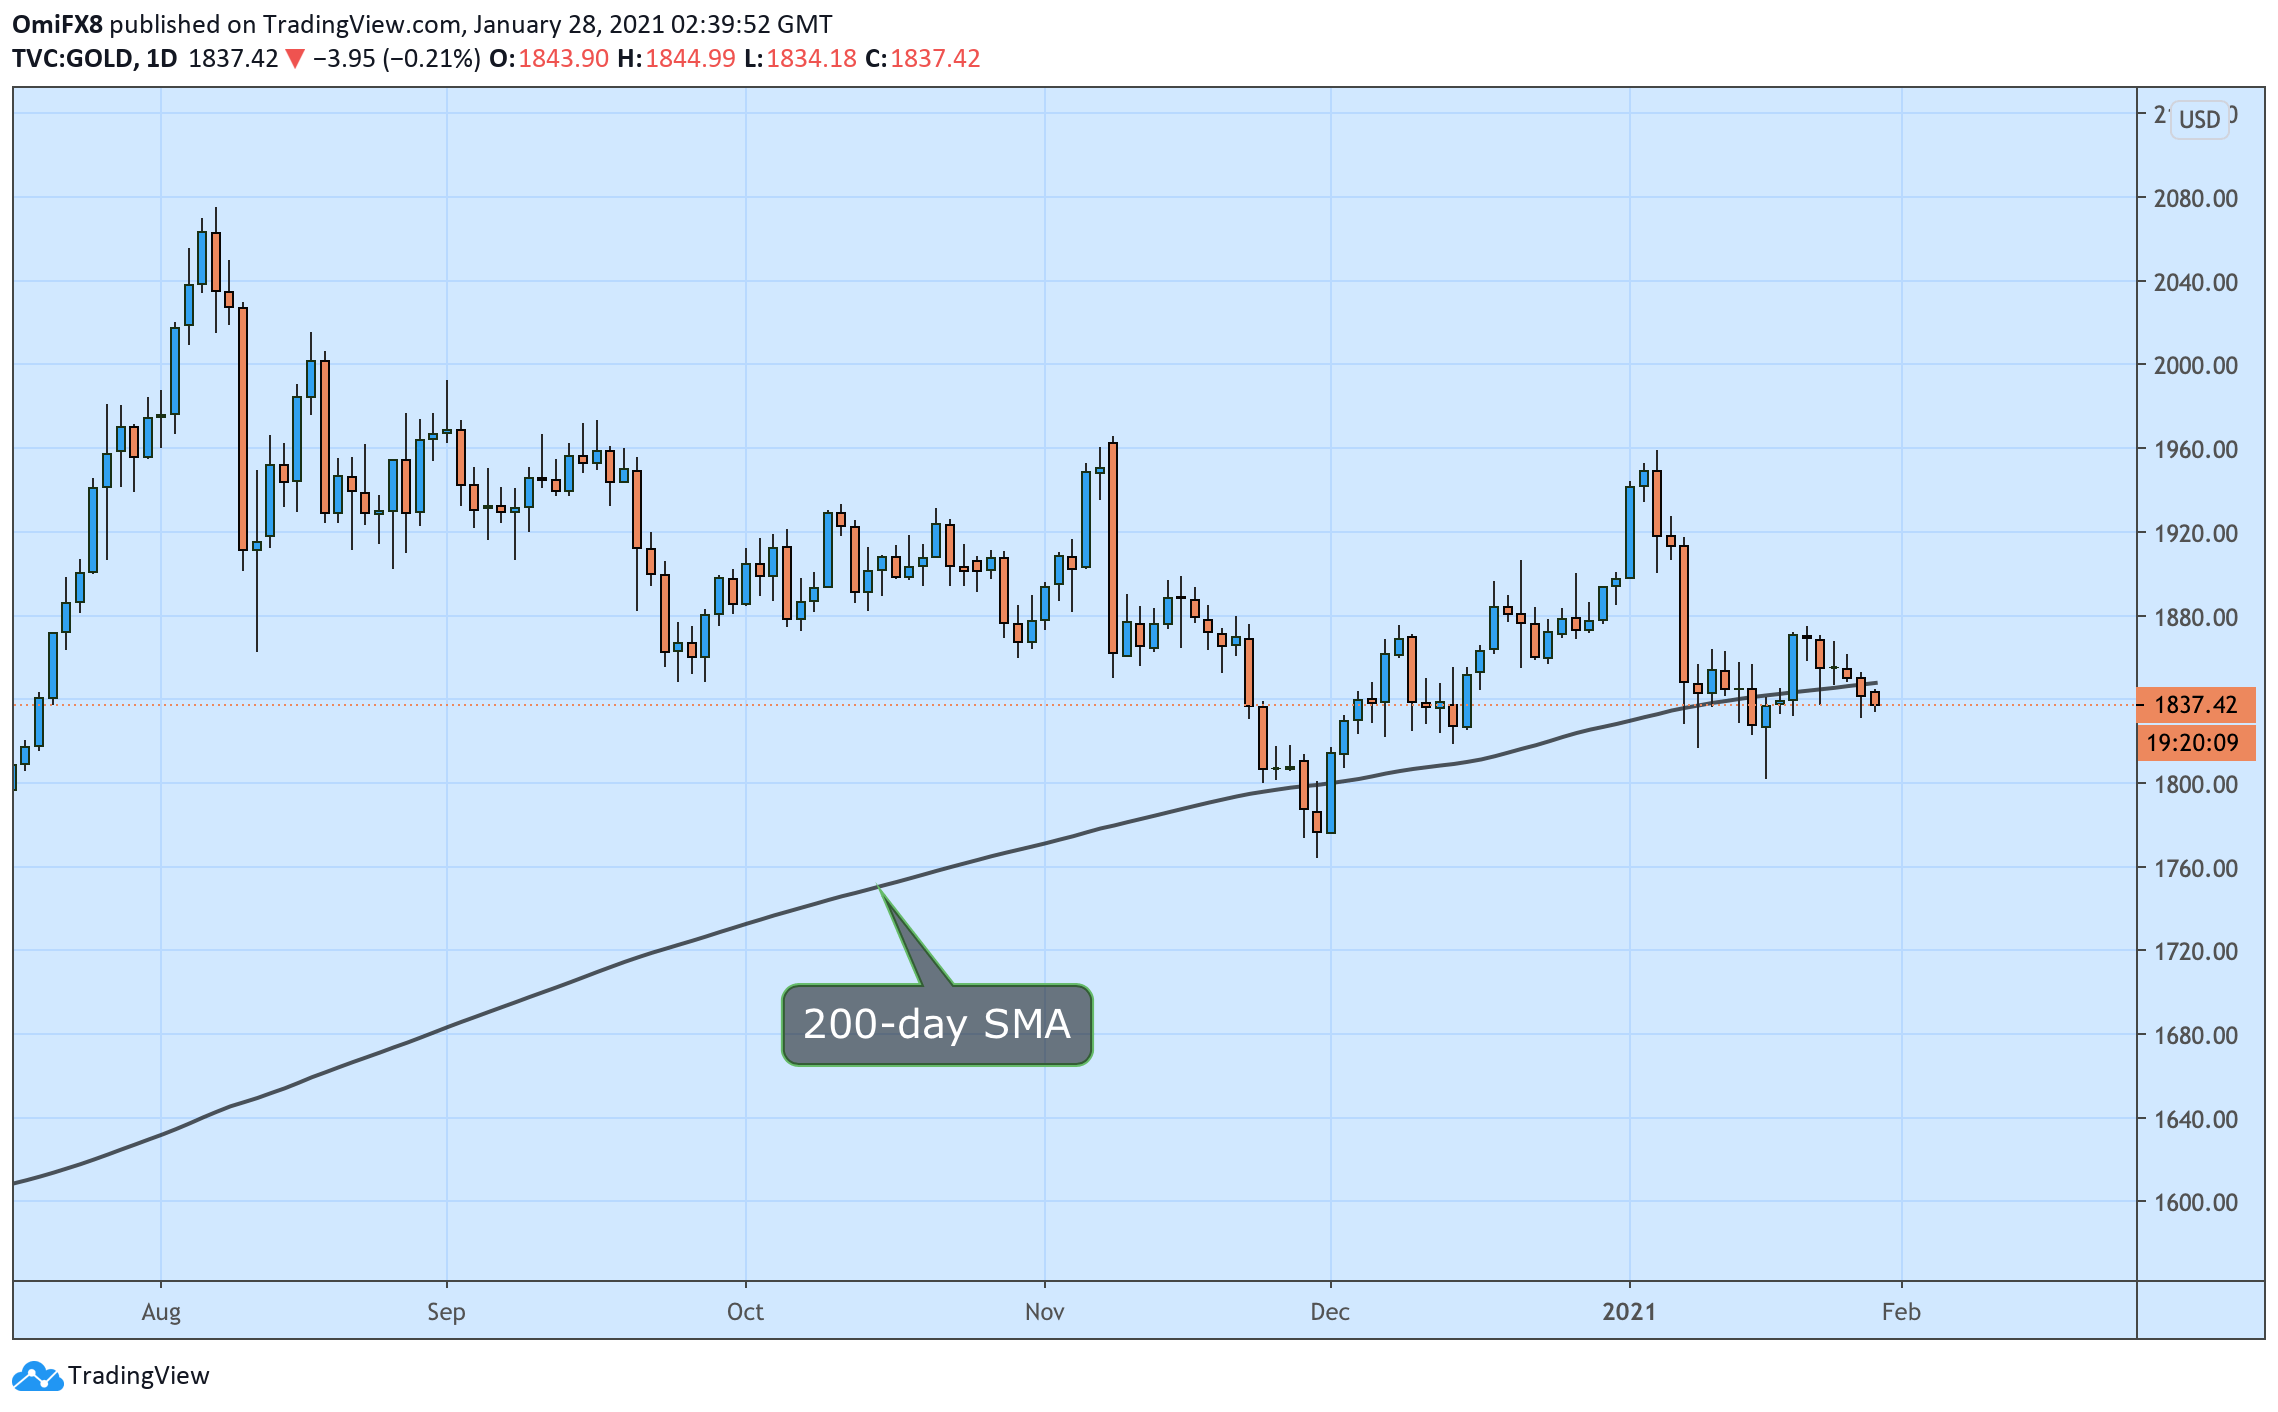
Trend: Bearish
Technical levels
