- Gold has pulled back by $10 from the session high of $1,818.
- The weekly chart shows the path of least resistance is to the downside.
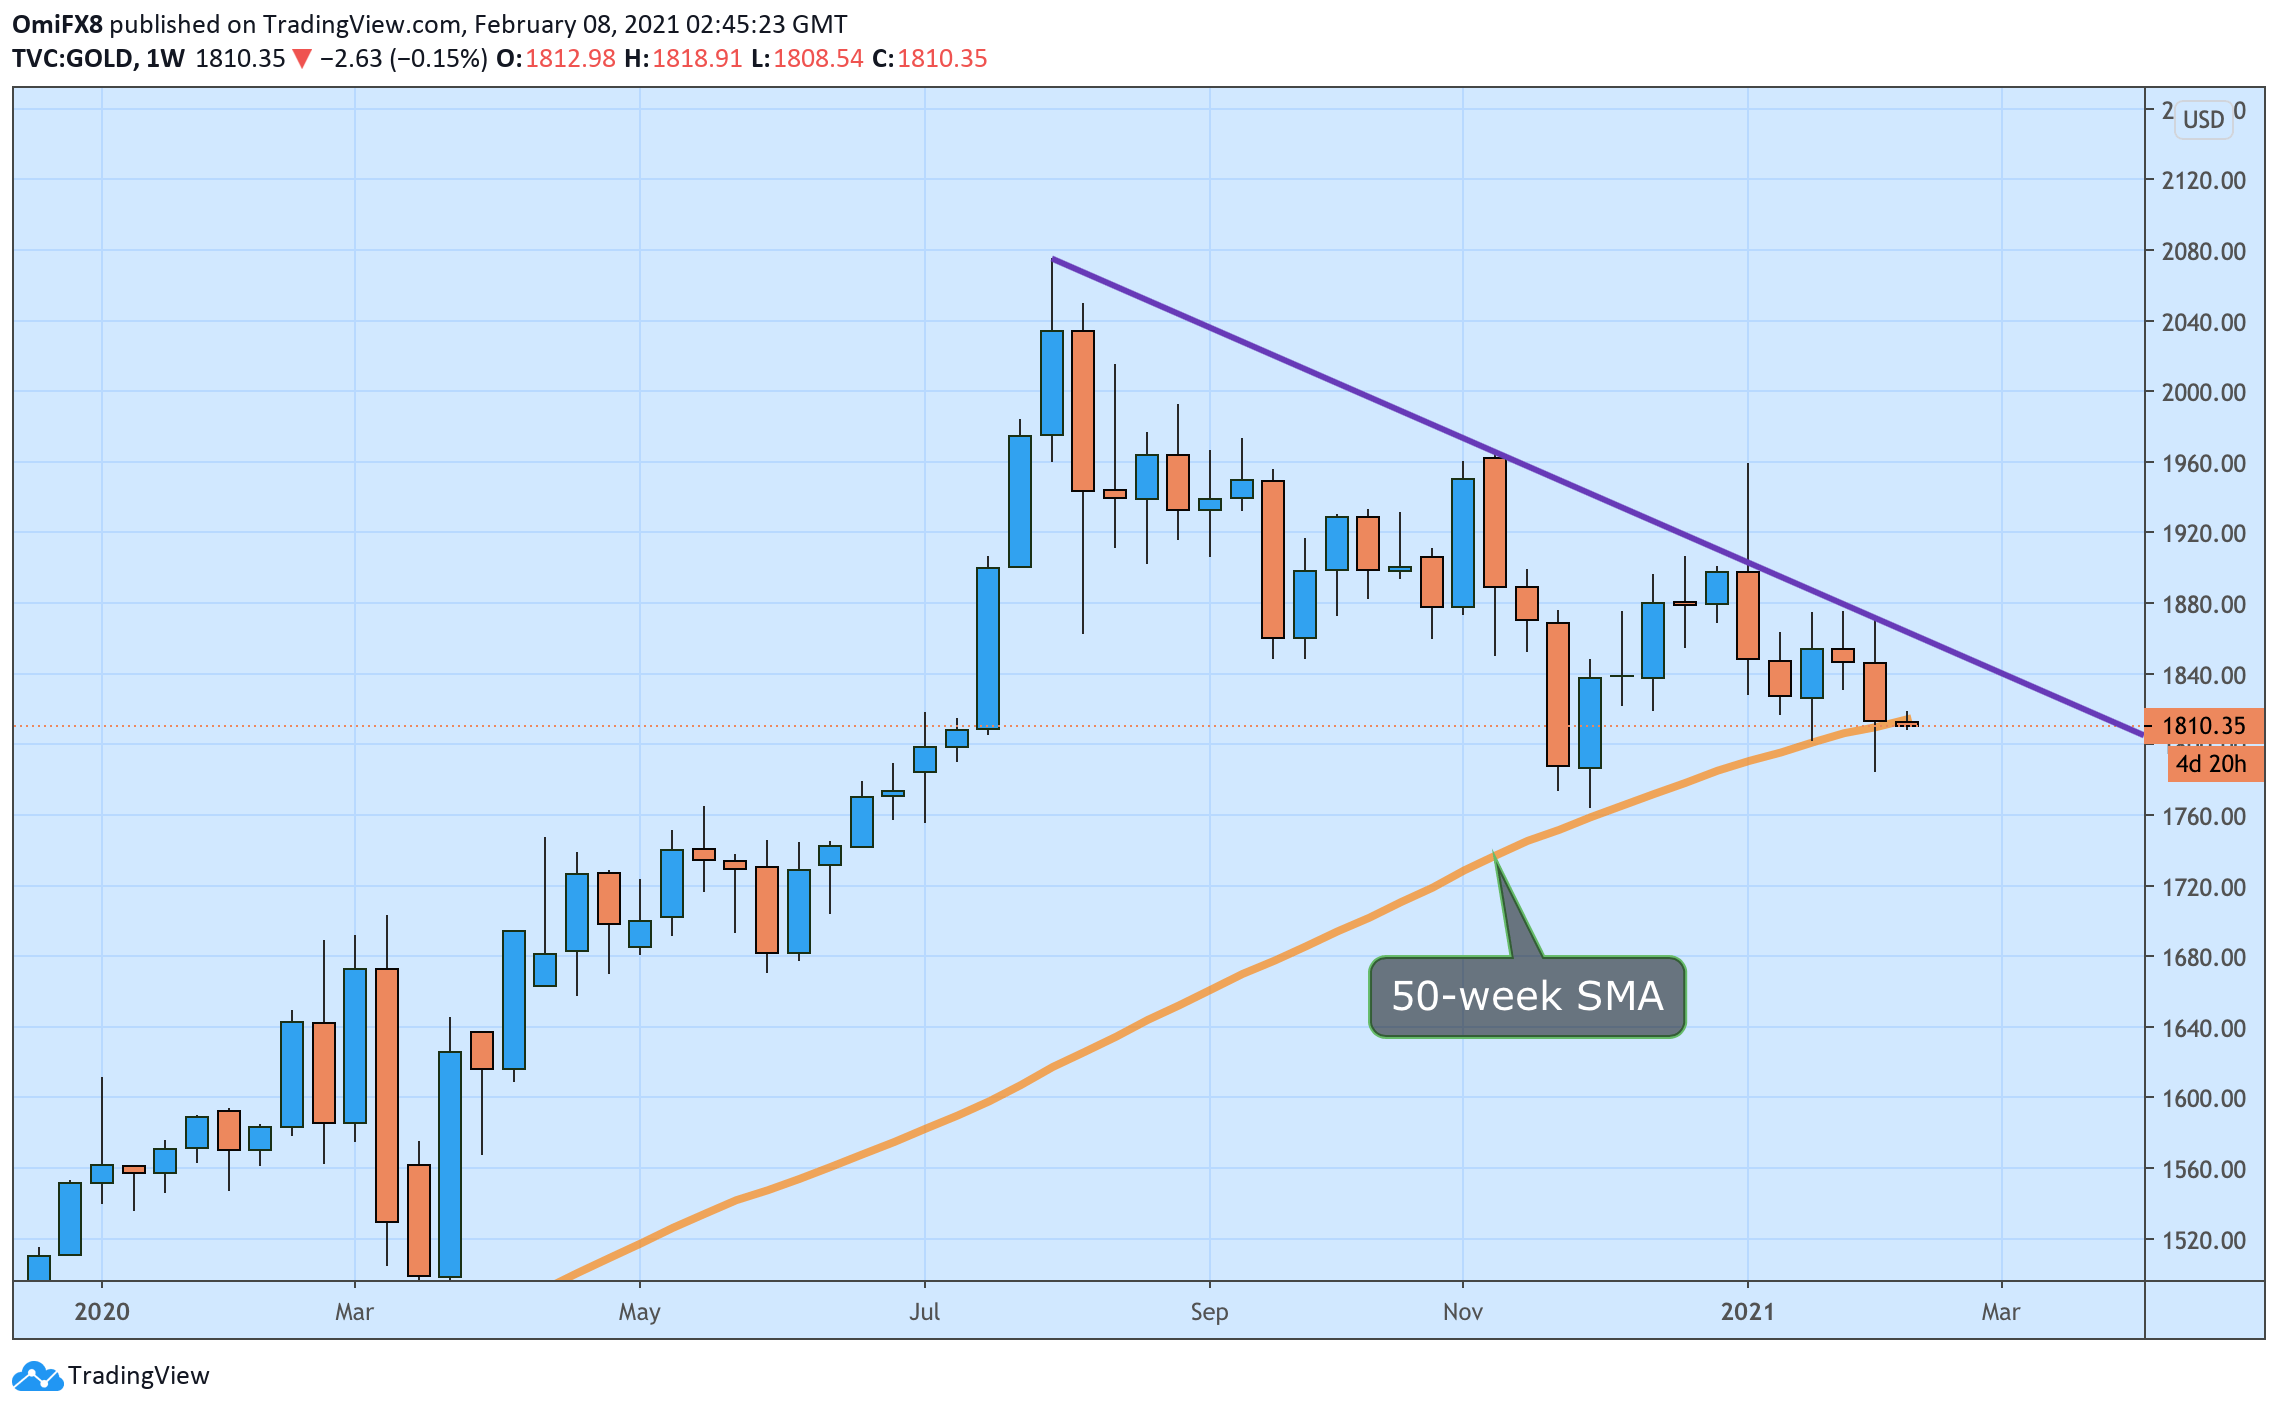
Gold (XAU/USD) is trading near $1,808 per ounce at press time, having failed to keep gains above the 50-week Simple Moving Average (SMA) hurdle at $1,815 early Monday.
Last week’s rejection at the trendline falling from August and November highs, coupled with the below-50 reading on the weekly chart Relative Strength Index, suggests the path of least resistance is to the downside.
As such, a re-test of Thursday’s low of $1,785 looks likely. A violation there would expose the Nov. 30 low of $1,764. A move above the weekly chart descending trendline is needed to confirm a reversal higher.
Weekly chart
Trend: Bearish
Technical levels
