- XAU/USD consolidates the downside within a pennant on the 1H chart.
- RSI has turned south while trending well below the midline.
- US NFP holds the key as gold struggles below $1700.
Having hit nine-month lows at $1687 earlier this Friday, Gold (XAU/USD) bulls are struggling to extend the recovery above the $1700 level.
Gold prices have entered a phase of consolidation following a failure to find acceptance above the latter on a couple of occasions. Thus, XAU/USD carved out a pennant pattern on the hourly sticks.
Gold Price Chart: Four-hour
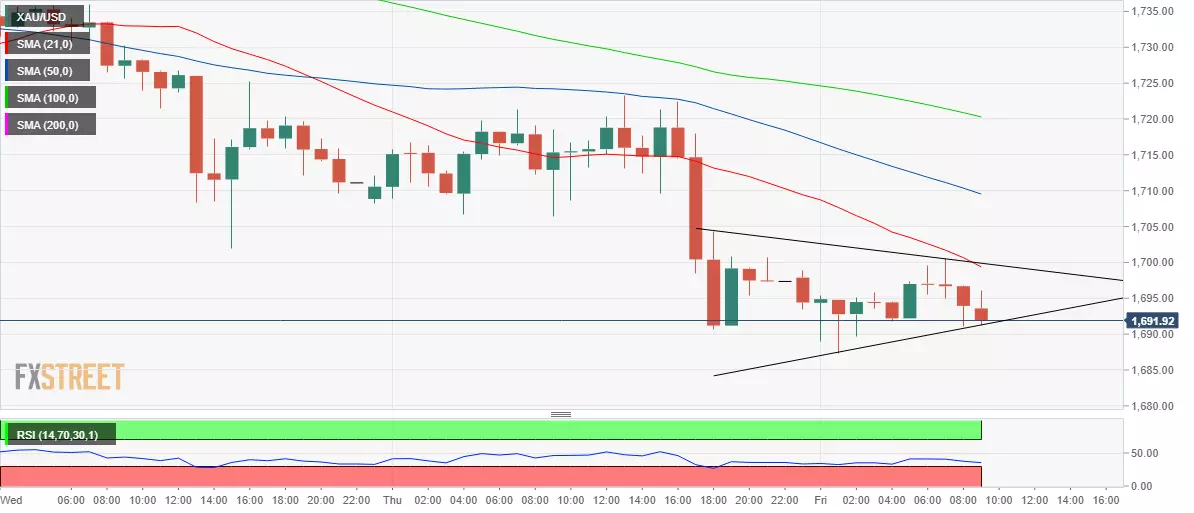
An hourly closing below the rising trendline support at $1691 could validate a pennant breakdown, opening floors for a test of $1674/72 levels, which is the confluence of the pattern target and the June 2020 low.
The relative strength index (RSI) has turned south while trending within the bearish zone, suggesting that there is more scope to the downside.
Alternatively, a sustained move above the $1700 level, the convergence of the bearish 21-hourly moving average (HMA) and the pattern resistance, could revive the recovery momentum toward the 50-HMA at $1710.
Gold Additional levels
