Gold is feeling the pull of gravity during Tuesday’s Asian trading hours. 
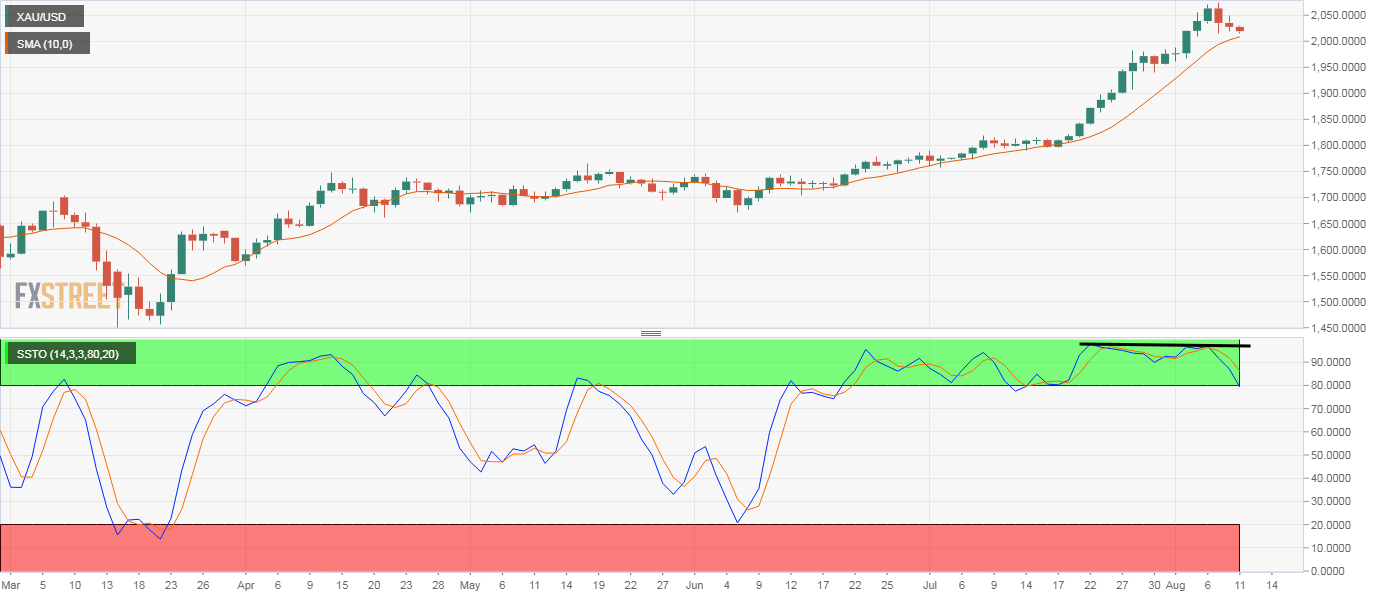
Gold’s daily chart stochastic has diverged in favor of the bears. RSI continues to report overbought conditions with an above-70 print. Gold is trading in the red near $2,017 per ounce at press time, having put in a record high of $2,075 on Aug. 7. The pullback has confirmed the bearish divergence of the daily chart slow stochastic indicator. A bearish divergence occurs when an indicator prints lower highs against higher highs on price and is widely considered a sign of ebbing of bullish momentum. The 14-day relative strength index (RSI) is also echoing similar sentiment with an above-70 or overbought reading. The yellow metal risks falling to the ascending 10-day simple moving average (SMA) support located at $2,007. A violation there would expose the psychological support of $2,000. On the higher side, the hourly chart lower high of $2,049 is the level to beat for the bulls. A break higher would open the doors for a re-test of the record high of $2,075. Daily chart Trend: Bearish Technical levels FX Street FX Street FXStreet is the leading independent portal dedicated to the Foreign Exchange (Forex) market. It was launched in 2000 and the portal has always been proud of their unyielding commitment to provide objective and unbiased information, to enable their users to take better and more confident decisions. View All Post By FX Street FXStreet News share Read Next WH Adviser O’Brien: US is ‘deeply troubled’ by arrest of Hong Kong media tycoon Jimmy Lai FX Street 2 years Gold is feeling the pull of gravity during Tuesday's Asian trading hours. Gold's daily chart stochastic has diverged in favor of the bears. RSI continues to report overbought conditions with an above-70 print. Gold is trading in the red near $2,017 per ounce at press time, having put in a record high of $2,075 on Aug. 7. The pullback has confirmed the bearish divergence of the daily chart slow stochastic indicator. A bearish divergence occurs when an indicator prints lower highs against higher highs on price and is widely considered a sign of ebbing of bullish momentum. The… Regulated Forex Brokers All Brokers Sponsored Brokers Broker Benefits Min Deposit Score Visit Broker 1 $100T&Cs Apply 0% Commission and No stamp DutyRegulated by US,UK & International StockCopy Successfull Traders 9.8 Visit Site FreeBets Reviews$100Your capital is at risk. 2 T&Cs Apply 9.8 Visit Site FreeBets Reviews$100Your capital is at risk. 3 Recommended Broker $100T&Cs Apply No deposit or withdrawal feesTrade major forex pairs such as EUR/USD with leverage up to 30:1 and tight spreads of 0.9 pips Low $100 minimum deposit to open a trading account 9 Visit Site FreeBets ReviewsYour capital is at risk. 4 T&Cs Apply Visit Site FreeBets ReviewsYour capital is at risk. 5 Recommended Broker $0T&Cs Apply Trade gold, silver, and platinum directly against major currenciesUp to 1:500 leverage for forex trading24/5 customer service by phone and email 9 Visit Site FreeBets ReviewsYour capital is at risk.