- Gold consolidates near-daily highs, eyes $1900.
- Bullish crossover on the hourly chart keeps the buyers hopeful.
- The spot trades above all key averages, with a bullish RSI.
Gold (XAU/USD) continues to probe the upper band of Thursday’s trading range so far, as the $1900 barrier remains in sight amid a favorable technical setup in the near-term.
As observed in the hourly chart, gold sits comfortably above all the major hourly moving averages (HMA), as of writing.
Gold Price Chart: Hourly
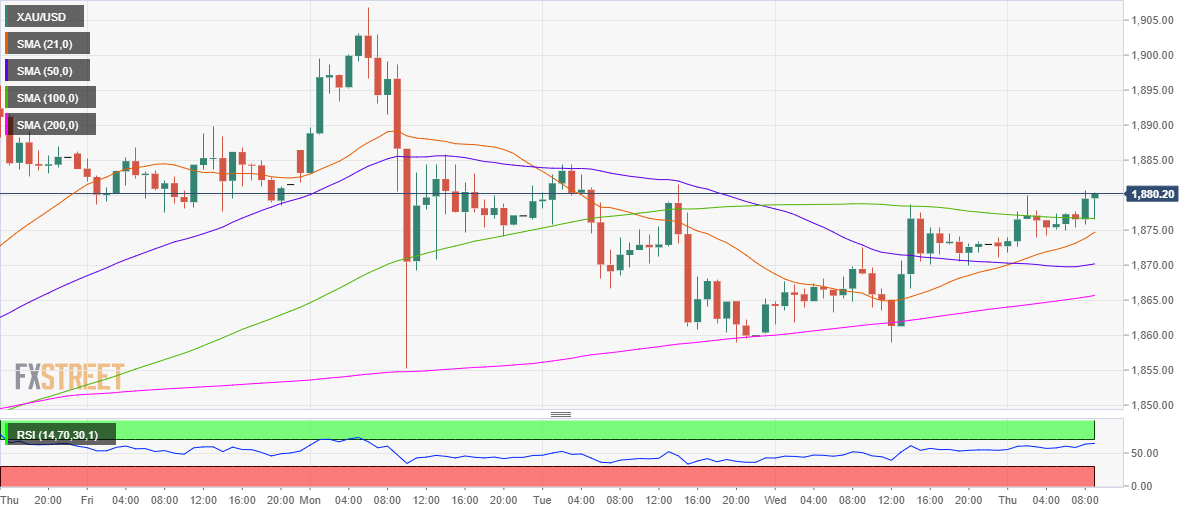
The bullish crossover on the said time frame, with the 21-HMA having cut the 50-HMA from below, adds credence to the bullish momentum.
Further, the Relative Strength Index (RSI) holds firmer well above the midline, currently at 62.90, suggesting that there is more room to the upside.
The next relevant resistance is seen at the December 22 high of $1884 above which the $1900 level could be tested.
Alternatively, the bullish bias remains intact so long as the price holds above the 200-HMA at $1866. Ahead of that the 50-HMA support at $1870 could come into play.
Gold Additional levels
