Gold (XAU/USD) is licking its wounds after sliding 2% on Tuesday, courtesy of the robust demand for the US dollar as a safe-haven. The impasse on the US fiscal stimulus and growing coronavirus fears tempered the market sentiment. Two pharma giants pause their vaccine trials recently due to some unexplained side-effects.
Looking ahead, fresh updates on the virus cases and stimulus will be closely eyed amid ongoing Brexit noise. Let’s see how gold is positioned on the charts?
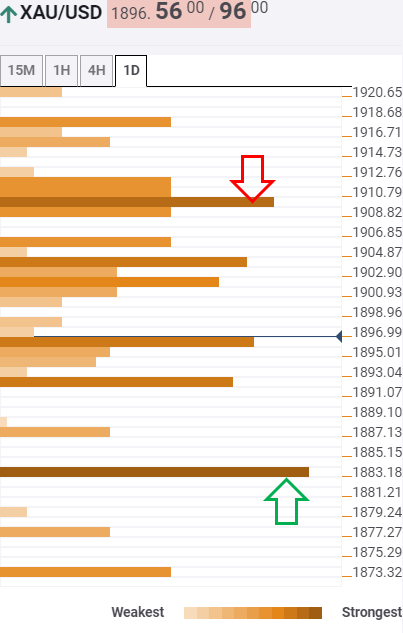
Gold: Key resistances and supports
The Technical Confluences Indicator suggests that the XAU bulls will face a hard time on the road to recovery amid a stack of healthy resistance levels.
A powerful resistance is aligned around $1901-03, the convergence of the Fibonacci 38.2% one-month and one-day.
The next level to beat for the bulls is $1910, the SMA100 one-hour. Acceptance above the latter could open doors towards a test of the Fibonacci 23.6% one-week, the $1917 level.
Alternatively, immediate support is seen at $1892, the intersection of the pivot point one-week S1 and Bollinger Band four-hour Lower.
A break below that level could likely accelerate the downward momentum, with $1873 next in sight. That level is the previous week low.
Here is how it looks on the tool
About Confluence Detector
The Confluence Detector finds exciting opportunities using Technical Confluences. The TC is a tool to locate and point out those price levels where there is a congestion of indicators, moving averages, Fibonacci levels, Pivot Points, etc. Knowing where these congestion points are located is very useful for the trader, and can be used as a basis for different strategies.
Learn more about Technical Confluence
