The recovery in Gold (XAU/USD) from multi-month lows gathered steam on Thursday after the US dollar tumbled in tandem with the Treasury yields. Gold rallied over 1% to settle the holiday-shortened week above the critical resistance at $1729.
Investors cheered strong US manufacturing data and President Biden’s infrastructure plan, which boosted global stocks at the expense of the safe-haven gold. Technically, gold’s recovery seems to have some legs but its fate hinges on the US NFP release and next week’s FOMC minutes.
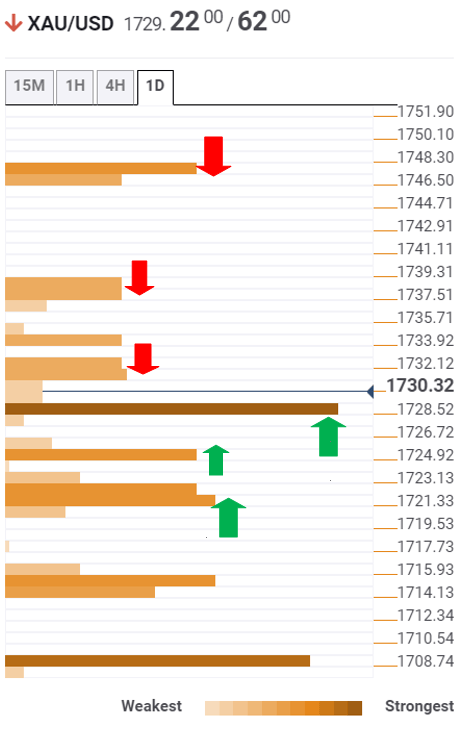
Gold Price Chart: Key resistance and support levels
The Technical Confluences Detector shows that gold faces immediate resistance at $1732, which is the Fibonacci 38.2% one-week.
A dense cluster of resistance is seen around the $1737 area, which is the confluence of SMA200 four-hour and Fibonacci 61.8% one-week.
The bulls will then look to challenge powerful resistance at $1747, the convergence of the previous week high, pivot point one-day R2 and pivot point one-week R1.
Alternatively, a sustained break below the $1929 support – the intersection of the Fibonacci 23.6% one-week and Fibonacci 61.8% one-month – could revive the downside bias.
The next relevant support is seen around $1725, the confluence of the SMA10 one-day and Fibonacci 23.6% one-day.
Further south, $1720 could likely test the bearish commitments. At that point, the Fibonacci 38.2% one-day coincides with the previous week low.
Here is how it looks on the tool
About Technical Confluences Detector
The TCD (Technical Confluences Detector) is a tool to locate and point out those price levels where there is a congestion of indicators, moving averages, Fibonacci levels, Pivot Points, etc. Knowing where these congestion points are located is very useful for the trader, and can be used as a basis for different strategies.
