- Gold sold-off 2% on Friday, loses $56 on the week.
- XAU/USD could see a quick pullback before the downside resumes.
- Daily RSI has pierced through the midline, into the bearish zone.
Gold (XAU/USD) recovered some ground into the weekly closing, although booked a 2% loss on Friday.
The sell-off knocked-off the metal to the weakest levels in three weeks at $1828.
Gold Price Chart: Daily
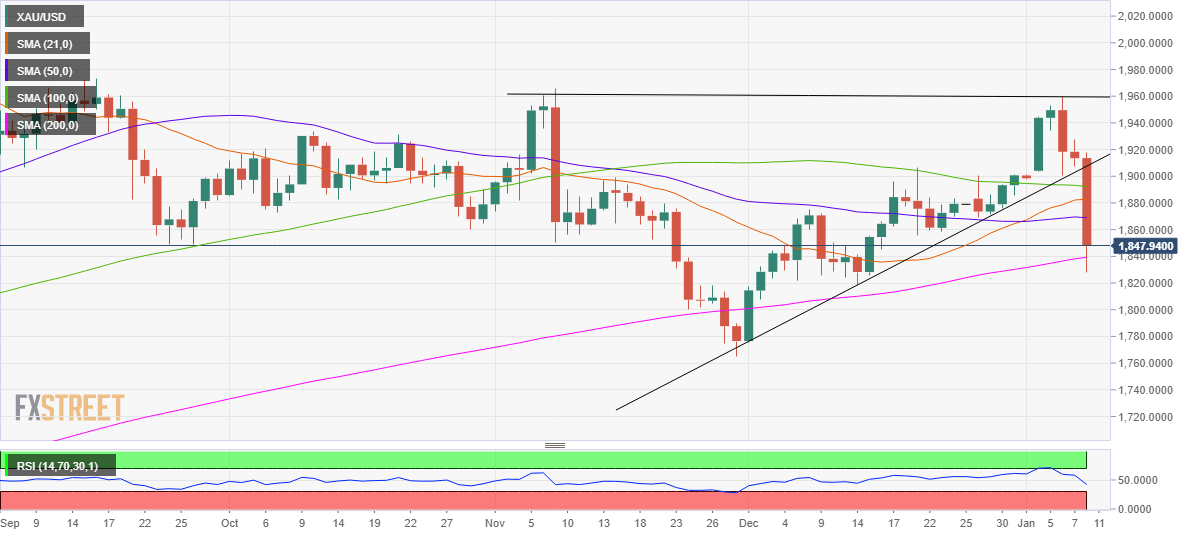
The price cut through all the key daily moving averages (DMA) on its downside break of the ascending triangle formation on the daily chart.
However, the XAU bulls recovered to $1848 levels, having recaptured the critical 200-DMA at $1839 as the week drew to an end. The spot lost as much as $70 on Friday while eroding $56 on a weekly basis.
The triangle breakdown validation prompted the 14-day Relative Strength Index (RSI) to pierce the midline from above, entering into the bearish zone.
All in all, the path of least resistance appears to the downside, although a dead cat bounce towards the horizontal 50-DMA at $1869 cannot be ruled, as the price managed to close the week above the 200-DMA.
On the flip side, the sellers remain poised to test the $1800 level, below which the four-month lows of $1764 could be challenged.
Gold Additional levels
