- Today, the investors await readings on the US consumer price index from the Bureau of Labor Statistics.
- On Tuesday, the gold price forecast remains neutral in a narrow trading range of 1,796 – 1,784 levels.
- Forex trading market participants may buy above the $1,783 level to target the $1,801.
Gold prices closed at $1794.55 after setting a high of $1800.05 and a low of $1785.10. Gold prices were unresponsive on Tuesday as the US dollar is firm. At the same time, investors await readings on the US consumer price index from the Bureau of Labor Statistics. On Tuesday, the gold price forecast remains neutral in between a narrow trading range of 1,796 – 1,784 levels.
If you are interested in trading XAU/USD with forex robots, check out our guide.
The bullish dollar weighs on gold prices.
Investors had their eyes on this data as it could be crucial to the Fed’s decision on when to start reducing its supportive measures. The US Dollar Index reached 92.89, its highest since August 27th, during trading hours on Monday. However, the index could not remain there for long and started declining to reach 92.6. Thus, it added downward pressure on the greenback.
The US Treasury yield on the 10-year note fell and reached 1.31%, which added further pressure on the US dollar. The weakness in the US dollar gave a push to gold prices, and it recovered some of its previous losses on Monday.
US Department of the Treasury Reports the Federal Budget Balance
On the data front, at 22:47 GMT, the Federal Budget Balance in August showed a deficit of -170.6B against the forecasted -260.5B. Thus, it weighed on the US dollar that added further gains in gold prices.
August’s CPI reading from the Bureau of Labor Statistics is at the forefront of this week’s market calendar. The economists are wondering whether the inflation spike will decrease this year as claimed by the Federal Reserve. The US CPI data is due on Tuesday and is expected to come in as 5.3%. In July, the CPI growth slowed but remained at a 13-year high of 5.4%.
The Federal Reserve’s Tapering Program is in the spotlight.
The Federal Reserve is preparing for its September policy meeting, and its focus is largely on August’s CPI numbers to have clear ideas about reducing stimulus measures. The question of whether the Fed ought to taper its stimulus and raise interest rates has been debated for many months now. Although the economic recovery has picked up its pace, the resurgence of the Delta variant of the coronavirus has conflicted with the idea of tapering.
Meanwhile, Cleveland Federal Reserve President Loretta Mester said that she would still like the central bank to begin tapering asset purchases this year. He joined the team of policymakers in making it clear that their plans to start reducing support were not disrupted by weaker job growth in August. These comments supported the US dollar a little and further capped gains in gold prices.
Gold Price Forecast – Daily Support and Resistance
Support Resistance
1786.41 1801.36
1778.28 1808.18
1771.46 1816.31
Pivot Point: 1793.23
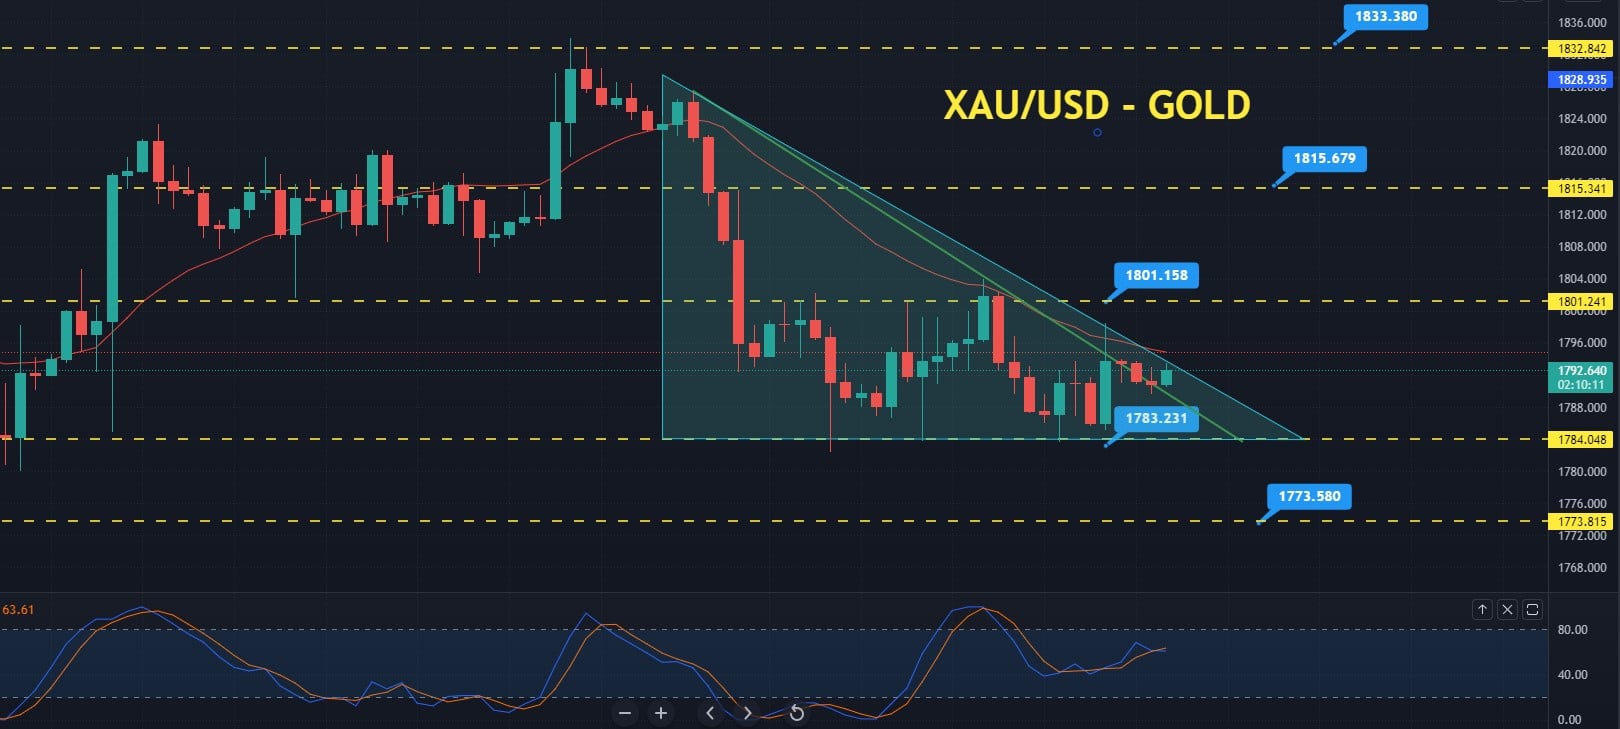
Gold Price Forecast – Descending Triangle Underpins Gold at 1,783
On Tuesday, the gold price forecast remains neutral in a narrow trading range of 1,796 – 1,784 levels. On the 4 hour timeframe, gold faces immediate resistance at the 1,796 level, which is being extended by 50 periods of the exponential moving average.
A bullish breakout of the 1,796 level will likely extend a buying trend until the next resistance level of 1,801. Moreover, a further bullish breakout of the 1,801 level exposes gold prices towards the next resistance level of the 1,815 level.
Alternatively, gold may find immediate support at the pivot point level of 1,783. However, a bearish breakout below this level could extend the selling trend until the next support levels of 1,777 and 1,773.
Taking a look at the 50 period EMA (exponential moving average – red line), it is holding around the 1,793 level. The closing of candles below this level supports a selling bias in the precious metal, gold. Moreover, the leading indicator, Stochastic RSI, rests in a selling zone below 50. It indicates a selling bias in gold.
Lastly, the descending triangle pattern typically breaks below on the lower side. Therefore, the violation of the 1,783 level can trigger further selling until the 1,773 level in gold.
Therefore, Forex trading market participants may buy above the $1,783 level to target the $1,801. Alternatively, traders can take a sell position below the $1,783 level today. All the best!
Looking to trade forex now? Invest at eToro!
67% of retail investor accounts lose money when trading CFDs with this provider. You should consider whether you can afford to take the high risk of losing your money.