- S&P 500 Futures portray a soft start to the week, dropping by 0.10% intraday around 4,530 during early Monday.
- The 50 day EMA (exponential moving average – red line) holds at the $1,822 level, supporting gold’s bullish trend.
- Forex trading market participants may sell below the $1,832 level to target $1,822.
The yellow metal price failed to stop its early-day downward rally. It remained below a two-and-a-half-month high. The gold price forecast remains bullish. However, it is exhibiting a bearish correction below the $1,832 level today.
If you are interested in trading XAU/USD with forex robots, check out our guide.
Weakness in the US dollar underpins gold prices.
The downbeat readings of the US jobs report indicated that the US Federal Reserve could delay its asset tapering timeline, giving the yellow metal a boost. On the other hand, the broad-based US dollar strength took a further seat. It weighed on the yellow-metal prices, as the price of gold is inversely related to the US dollar price. The ever-increasing fears over the Delta covid variant spread kept the market trading sentiment under pressure. Thus, the risk-off market sentiment boosted the safe-haven US dollar demand.
In contrast to this, the ongoing downbeat market sentiment may help gold prices in the wake of safe-haven demand. The gold price is trading at 1,826.53 and consolidating in the range between 1,825.25-1,830.28.
Fresh Coronavirus Woes and a Lack of Major Data Support Gold
The market trading sentiment failed to stop its previous long downward performance and remained depressed on the day. The fresh coronavirus woes and a lack of significant data/events put pressure on global equities.
That said, the S&P 500 Futures portray a soft start to the week, dropping by 0.10% intraday around 4,530 during early Monday. The key US stock futures were being pressured by the holiday in the US and Canada. The fears of disappointment from the European Central Bank (ECB), the Reserve Bank of Australia (RBA), and the Bank of Canada (BOC) during their upcoming monetary policy support gold.
Even though Australia’s most populous state, New South Wales, marked a bit of an easing in the covid figures. However, the market’s trading sentiment failed to take advantage of this. Furthermore, New Zealand recorded no new virus cases outside Auckland and is considering easing the alert level outside the capital. That failed to have any positive impact on global equities.
China–Taiwan tussles boost Safe-haven.
The China–Taiwan tussles and the absence of significant catalysts from the Asian majors added further to the market’s inactive performance.
Additionally, the previously released downbeat US employment data for August and the weak ISM Services PMI raise challenges for the global economic outlook. It put further downside pressure on the market mood. However, the downbeat mood underpinned the US dollar due to its safe-haven appeal, which in turn pushed the yellow metal down.
US Dollar & Gold Prices – Major Fundamentals in Review
The broad-based US dollar maintained its early-day upward rally on the USD front. However, it remained near a one-month low after investors postponed expectations of when the US Federal Reserve would start asset tapering. The reason behind its modest gains could be the risk-off market mod, which tends to underpin the safe-haven demand dollar.
In that way, the upticks in the US dollar held the bullion prices under pressure. That’s because the price of gold is inversely related to the US dollar price.
Due to national holidays in the US and Canada, the market traders will keep their eyes on the virus woes and the China–Taiwan tussles. Apart from this, the second-tier data could entertain gold traders amid an expected consolidation in the market’s mood.
Gold Price Forecast – Technical Levels
S3 1777.44
S2 1800.8
S1 1814.26
Pivot Point 1824.16
R1 1837.62
R2 1847.52
R3 1870.88
Gold Price Forecast – Ascending Triangle Breakout Breakout
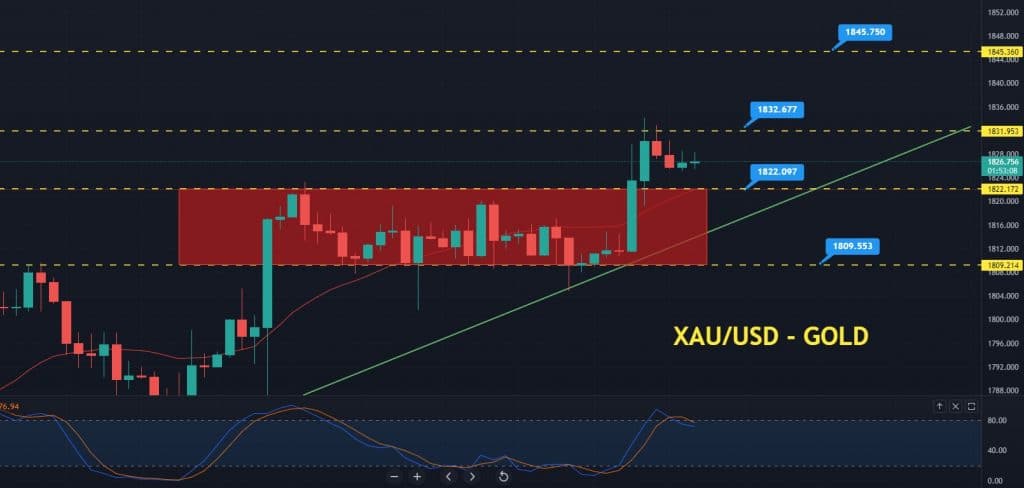
The gold price forecast remains bullish. However, it is exhibiting a bearish correction below the $1,832 level today. On the 4-hourly timeframe, gold has violated the ascending triangle pattern that extended resistance at the 1,822 level. Typically, the breakout of an ascending triangle pattern drives a bullish trend in gold prices.
On the bullish side, the resistance stays at the 1,832 level, and a bullish breakout of this level could extend the buying trend to 1,845. Alternatively, the selling trend dominates below the 1,832 support level.
On the bearish side, the support stays at the 1,822 level. That’s the same level that worked as resistance during the previous week. A bearish breakout of this level exposes gold prices to the next support levels of 1,817 and 1,809 levels.
The 50 day EMA (exponential moving average – red line) holds at the $1,822 level, supporting gold’s bullish trend. Moreover, the leading indicator, Stochastic RSI, stays above 50, keeping the bullish trend in gold. Therefore, the Forex trading market participants may sell below the $1,832 level to target the $1,822. Alternatively, traders can take a buying position above the $1,821 level today. All the best!
Looking to trade forex now? Invest at eToro!
67% of retail investor accounts lose money when trading CFDs with this provider. You should consider whether you can afford to take the high risk of losing your money.