- Gold opened at $1762 but soon slipped dramatically to a slow $1686 during the Asain session.
- Bureau of Labor Statistics reported NFP, and it rose to 943K against the forecasted 870K, dragging gold lower.
- Forex trading market participants may sell below $1,756 to target the $1,736 and $1,714 levels.
On Monday, gold prices opened at $1762 but soon slipped dramatically to a slow $1686 during the Asain session. It extended its decline on Monday and reached its lowest since March 2021. Gold price forecast remains bearish amid the strength of the US dollar after the release of better-than-expected jobs data.
If you are interested in trading XAU/USD with forex robots, check out our guide.
US Job Data Dampens Safe Haven Appeal – Gold Slips to $1,686
On Friday, the highly awaited jobs data from the US added further pressure on yellow metal as the figures came in favor of the US dollar. After the release of higher than expected figures from the US Labor Department, the greenback came in strength.
It triggered the hopes that the Fed might start tapering asset purchases sooner than expected. The expectations of a reduction in economic support from the central bank of the United States pushed the US dollar further high on board that dragged the yellow metal prices more than 4.7% in a single day.
The Federal Reserve has said that it will not start tapering the asset purchases until full employment is achieved. However, recently the governor of the Fed said that the job creation must fall between the range of 500,000 to 10,000,000 during upcoming months to start reducing bond purchases.
On Friday, the NFP data revealed that the job creation in July was about 943K which fell in the said range. It’s helping raise the Fed’s expectations to start tapering asset purchases in the 4th quarter of this year. These expectations weighed heavily on the yellow metal and dragged its prices to their lowest in more than one and a half months.
Apart from NFP, the Unemployment Rate from July also dropped, supporting the US dollar. At 17:30 GMT, the Average Hourly Earnings for the month of July surged to 0.4% against the projected 0.3%, adding further loss in gold prices.
The Non-Farm Employment Change also rose to 943K against the forecasted 870K, dragged gold further on the downside. The Unemployment Rate for July dropped to 5.4% against the predicted 5.7%.
Lastly, in July, the Final Wholesale Inventories (at 19:00 GMT) rose to 1.1% against the projected 0.8%. All the indicators weighed on the US dollar that further caped loss in gold.
US President Joe Biden Touted the Economic Recovery
The US President Joe Biden touted the economic recovery from the coronavirus pandemic after releasing better than expected NFP data and the Unemployment Rate report. However, he also said that more was needed as the Delta variant was surging and the vaccination was still not completed. Biden said his message isn’t one to celebrate as much of the work is left to be done regarding the surge in Delta variant and the continuation in economic recovery.
President also argued that the substantial July jobs numbers depicted that his administration’s policies strengthened the economy. He pushed Americans to get a vaccine shot to fight against the Delta variant of the coronavirus. The virus that’s causing about 400 people to die in a single day. These concerns that Delta variant still poses a threat against the economic recovery caped some of the losses in yellow metal on Monday.
Gold Price Forecast – Technical Levels
Support Resistance
1677.69 1765.34
1633.97 1809.27
1590.04 1852.99
Pivot Point: 1721.62
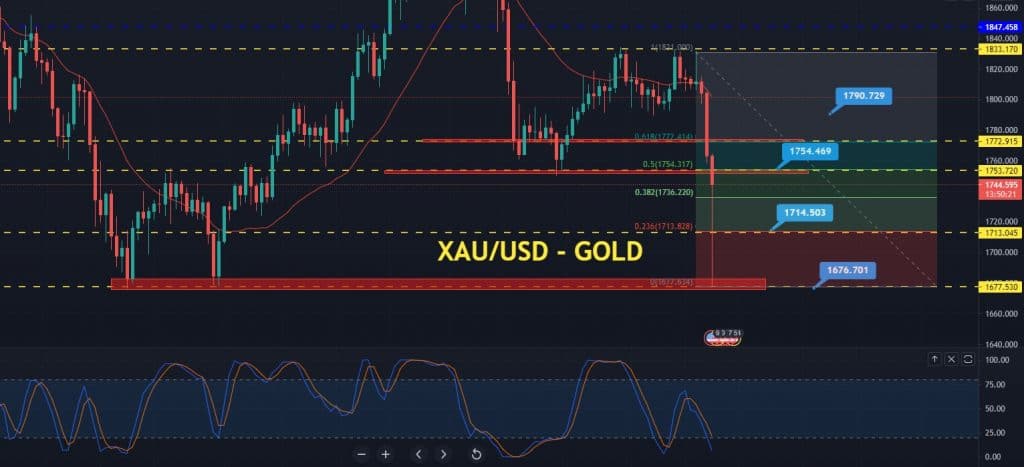
Gold Price Forecast – Daily Technical Analysis: 50% Fibonacci to Push XAU/USD Lower
Gold price forecast remains bearish below the $1,754 resistance level. On the daily chart, gold has completed 38.2% Fibonacci correction at $1,736 level, and now it’s heading further higher to test 50% Fibonacci retracement level of $1,754.
Bullish crossover of $1,754 level can drive additional buying in gold until $1,772 level. Closing candles below this level can extend selling bias in gold, and a sell limit can be placed at this level.
On the daily chart, the 50 days EMA (exponential moving average – red line) suggests an oversold situation as it’s holding at a $1,800 level. It means there’s still room for a bullish correction in gold prices. The leading indicator Stoahstic RSI still holds below 50, demonstrating a selling trend in gold. Thus, it’s better to capture a sell trade instead of trapping in anti-trend.
The Forex trading market participants may sell below $1,756 to target the $1,736 and $1,714 levels. Conversely, the sell limit can be placed at around $1,774 on Monday. All the best!
Looking to trade forex now? Invest at eToro!
67% of retail investor accounts lose money when trading CFDs with this provider. You should consider whether you can afford to take the high risk of losing your money.